
- Title
-
An optimized derivative of an endogenous CXCR4 antagonist prevents atopic dermatitis and airway inflammation
- Authors
- Harms, M., Habib, M.M.W., Nemska, S., Nicolò, A., Gilg, A., Preising, N., Sokkar, P., Carmignani, S., Raasholm, M., Weidinger, G., Kizilsavas, G., Wagner, M., Ständker, L., Abadi, A.H., Jumaa, H., Kirchhoff, F., Frossard, N., Sanchez-Garcia, E., Münch, J.
- Source
- Full text @ Acta Pharm Sin B

Binding mode of EPI-X4 with CXCR4 obtained by molecular docking. (A) Position of EPI-X4 (cyan) in the binding pocket of CXCR4 (cartoon). (B) Important interactions that stabilize the protein‒peptide complex: L1 (N-terminal amine), K6 and K7 of EPI-X4 are involved in salt-bridge interactions (indicated by green lines) with E31, D187 and D262, respectively. Hydrophobic interactions (indicated by yellow lines) are established between V2 of EPI-X4 and F29 and A180 of CXCR4. |

EPI-X4 WSC02 analogues inhibit X4-tropic HIV-1 infection with increased potency. WSC02 derivatives with either a single amino acid substitution (A), two distinct amino acid substitutions (B) or a combination of amino acid substitutions (C) were tested against X4-tropic HIV-1. TZM-bl reporter cells were preincubated with serially diluted peptide and afterwards inoculated with the virus. Infection rates were determined by β-galactosidase assay 3 days later. Data were represented as mean ± SEM (n = 3). |
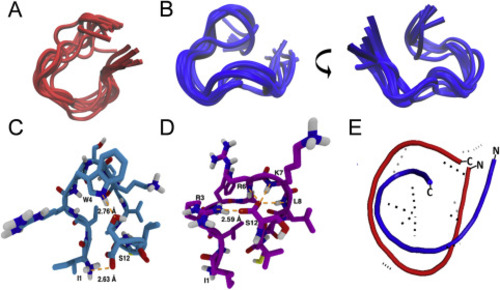
Solution structure of JM#21 and WSC02. Superimposition of the WSC02 (A) and JM#21 (B) conformers with the lowest final target function values calculated with ARIA. The visualization was performed with the Molecular Graphics Viewer of Visual Molecular Dynamics (VMD)37 (C) and (D) Intramolecular H-bonds in the WSC02 (C) and JM#21 (D) peptides color code: C = pink/blue, H = white, N = blue, and O = red. H-bonds are shown as dotted lines in orange. (E) Superimposed structures of WSC02 (red) and JM#21 (blue). |
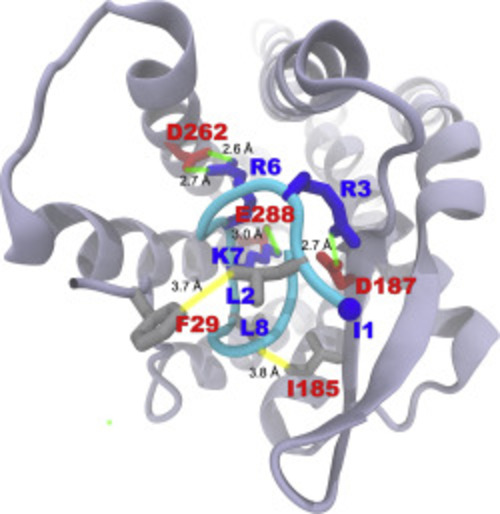
Binding mode of EPI-X4 JM#21 (cyan) with CXCR4 obtained by molecular docking. The color scheme is the same as in Fig.1. |

Competition of EPI-X4, WSC02, JM#21 and AMD3100 with the CXCR4 ECL-2 antibody 12G5. CXCR4 expressing SupT1 cells were precooled and assay buffer was removed. EPI-X4 and the optimized derivatives WSC02 and JM#21, and the small molecule AMD3100 were diluted in cold PBS and added to the cells. Immediately afterwards, a constant concentration of the APC-labelled CXCR4 antibody (clone 12G5) was added. After 2 h incubation at 4 °C unbound antibody was removed and cells analyzed in flow cytometry. Data were represented as mean ± SEM (n = 3). IC50 values were calculated by non-linear regression. |
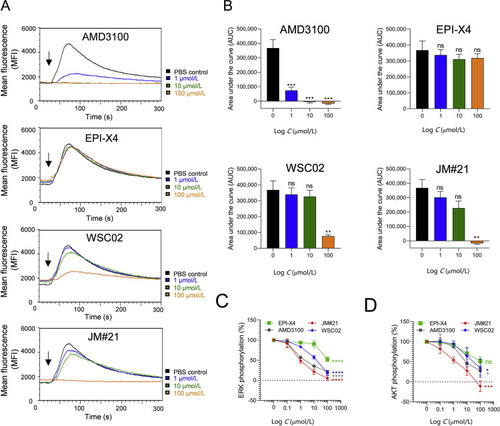
Effect of EPI-X4 derivatives and AMD3100 on CXCL12-evoked Ca2+ mobilization and ERK and AKT signaling. (A) Inhibition of CXCL12-induced calcium release. BCR-ABL expressing murine pro/pre B cells were loaded with Indo-1 AM and incubated with inhibitors for 10 min. Baseline fluorescence signal was recorded for 30 s and calcium flux induced by stimulation with 100 ng/mL mCXCL12 (black arrow). Signal was recorded for additional 260 s. (B) Areas under the curves (AUC) was calculated after baseline subtraction. Data were represented as mean ± SEM (n = 3). (C) and (D) Inhibition of CXCL12-induced ERK and AKT phosphorylation. SupT1 cells were preincubated with indicated concentrations of compounds for 15 min in starvation medium and afterwards stimulated with 100 ng/mL CXCL12 for 2 min. Cells were then permeabilized and stained for phosphorylated ERK (C) or phosphorylated AKT (D) and analyzed in flow cytometry. Data were represented as mean ± SEM (n = 3). IC50 values were determined by non-linear regression. ∗P < 0.05; ∗∗P < 0.01; ∗∗∗P < 0.001; ∗∗∗∗P > 0.0001; ns = not significant (one-way ANOVA in comparison to PBS control). |
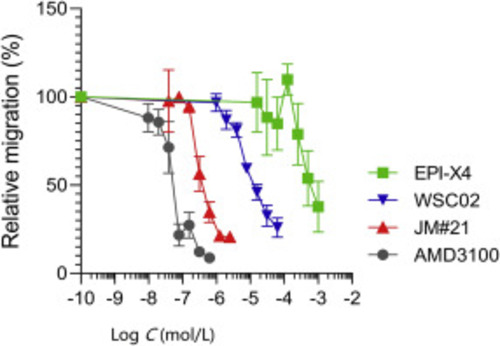
Migration of SupT1 cells in the presence of CXCR4 ligands towards a CXCL12 gradient. The assay was performed in a transwell plate with 5 μm pore size with 100 ng/mL CXCL12 in the lower chamber. The number of migrated cells was determined by CellTiterGlo assay. Data were represented as mean ± SEM (n = 3). |

Stability of EPI-X4 JM#21 in human plasma. 20 μmol/L of EPI-X4 JM#21 was diluted in 100% human plasma. The mixture was incubated at 37 °C and samples taken at indicated time points and stored at −80 °C. Samples were thawed in parallel, serially diluted in PBS and activity determined by 12G5-antibody competition. IC50 values were determined by non-linear regression and remaining activity calculated by IC50 (t = 0)/IC50 (t) × 100. Data were represented as mean ± SEM (n = 3). |

JM#21 is not toxic in an embryonic zebrafish model. At 24 h post fertilization, dechorionated zebrafish embryos were exposed to EPI-X4 (A), WSC02 (B) or JM#21 (C) for 24 h. As negative control PBS was used, and as positive control the antimicrobial peptide NRC-03. Shown are data derived from 60 embryos per group. |
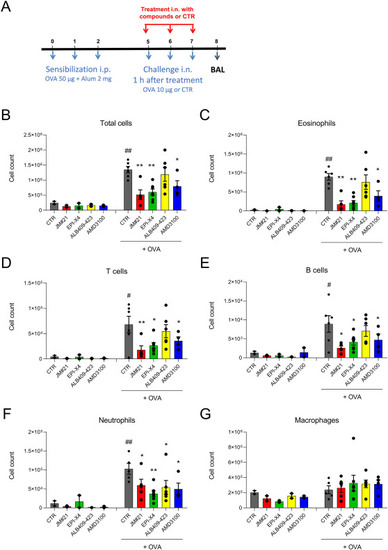
EPI-X4 JM#21 prevents immune cell infiltration into lungs in a mouse model of airway hypereosinophilia. (A) BALB/c mice were sensitized intraperitoneal (i.p.) with a mixture containing 50 μg OVA and 2 mg alum in 0.2 mL saline on day 0, 1 and 2. Mice were treated by intranasal (i.n.) administration with JM#21 (16 μmol/kg), EPI-X4 (16 μmol/kg), ALB409-423 (16 μmol/kg) or AMD3100 (12.6 μmol/kg), 2 h before each OVA or saline challenge on Day 5, 6 and 7. Mice were used for OVA-challenged groups (n = 4–6) and unchallenged controls (n = 2). Number of cells infiltrated into BAL were measured by flow cytometry, (B) all cells; (C) eosinophils; (D) T cells; (E) B cells; (F) neutrophils and (G) macrophages. Data were represented as means ± SEM. #P ≤ 0.05, ##P ≤ 0.01 compared to unchallenged control group, and ∗P ≤ 0.05, ∗∗P ≤ 0.01 compared to CTR + OVA group. |

(A) EPI-X4 JM#21 is active in a mouse model of atopic dermatitis. Ears of BALB/c mice were applied every two days with mock or MC903 (2.5 nmol/ear). (B) EPI-X4 JM#21 (400 nmol/ear), AMD3100 (315 nmol/ear), dexamethasone (Dexa, 20 nmol/ear) or ethanol (EtOH) were applied topically daily. Representative photographs of ears are taken at day 12. Ear thickness (C) and the inflammatory score (D) were determined daily. Mice were used for MC903 (n = 8–16) and controls (n = 4–7). Data shown are mean ± SEM. ####P ≤ 0.0001 compared to CTR + EtOH group, and ∗∗∗P ≤ 0.01, ∗∗∗∗P ≤ 0.0001 compared to MC903 + EtOH group. |