
- Title
-
ETS factors are required but not sufficient for specific patterns of enhancer activity in different endothelial subtypes
- Authors
- Neal, A., Nornes, S., Louphrasitthiphol, P., Sacilotto, N., Preston, M.D., Fleisinger, L., Payne, S., De Val, S.
- Source
- Full text @ Dev. Biol.
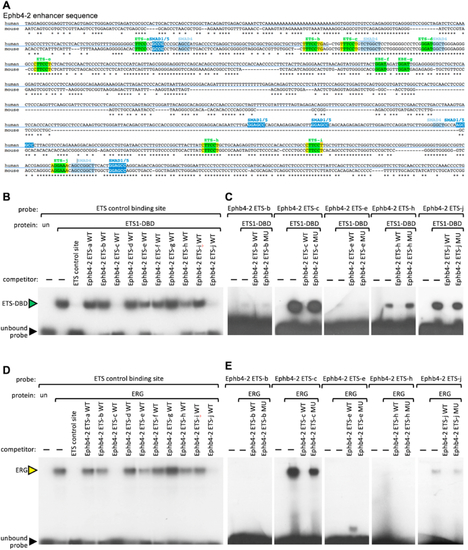
The Ephb4-2 venous enhancer contains functional ETS motifs. A. ClustalW alignment of the human and mouse sequences of the Ephb4-2 enhancer annotated with conserved ETS binding motifs (green), SMAD4 binding motifs (light blue) and SMAD1/5 binding motifs (dark blue) as previously reported ( |
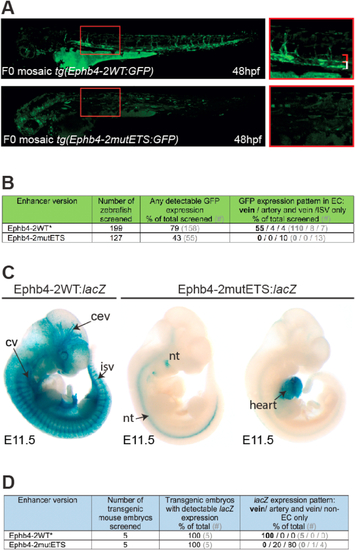
Fig. 2. ETS factor motifs are required for venous Ephb4-2 enhancer activity. A. Representative 48hpf F0 Tol2-mediated mosaic transgenic zebrafish expressing either wild type (upper panel) or ETS-motif mutated (lower panel) versions of the Ephb4-2:GFP transgene. Red box denotes region shown at high magnification on the left, red bracket indicates dorsal aorta, white bracket indicates cardinal vein. B. Table summarizing the n numbers and patterns of GFP expression in F0 Tol2-mediated transgenic zebrafish. ∗ indicates transgenic zebrafish already reported in Neal et al. (2019). Note that the total numbers of zebrafish screened is lower than reported in Neal et al. (2019), as they exclude analysis that did not record vein/arterial/isv expression patterns. C. Representative E11.5 F0 transgenic mouse embryos expressing either wild type (left panel) or ETS-motif mutated (right panels) versions of Ephb4-2:lacZ transgenes. cev = branches of cerebral venous plexus, cv = cardinal vein, isv = intersomitic vessel, nt = neural tube. All additional transgenic embryos are shown in Fig. S5. D. Table summarizing the n numbers and patterns of X-gal staining in F0 transgenic mouse embryos. ∗ denotes data initially reported in Neal et al. (2019). |
Knockdown of |
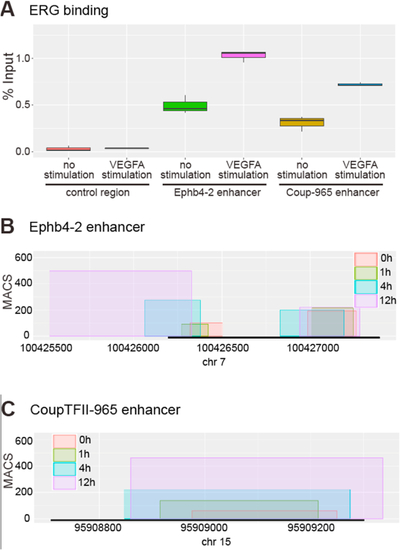
VEGFA signalling increases ETS factors binding to venous enhancers. A. HUVEC ERG binding ChIP-qPCR box-and-whiskers plot. ERG binding in unstimulated HUVECs is significantly enriched at the Ephb4-2 p < 0.001 (green) and CoupTFII-965 p < 0.001 (yellow) enhancers compared to the control region. Stimulation of HUVECs with VEGFA for 1.5 h prior to analysis resulted in significantly enriched ERG binding at both the Ephb4-2 p < 0.001 (pink) and CoupTFII-965 p < 0.001 (blue) enhancer regions compared to unstimulated conditions. No enrichment is observed between control regions (p = 1.000). The six conditions show significant differences (ANOVA f-test, p < 1 × 10⁻⁹). Horizontal lines = medians, boxes = interquartile range (IQR); vertical lines = minimal/maximal values. Data represents three biological replicates each with three technical replicates performed in triplicate. All data points were included in statistical analysis. Figure S9 shows the data presented alongside the IgG controls. B–C. ETS1 binding at venous Ephb4-2 (B) and CoupTFII-965 (C) enhancer regions is increased in the hours after VEGFA stimulation. Box width indicates region of ETS1 binding and box height indicates the maximal MACS score for this region after 0h (red), 1 h (green), 4 h (blue) and 12 h (purple) of VEGFA stimulation. Black bar indicates orthologous enhancer region and x axis covers a 5 kb genomic region. Numbers indicate distance from transcriptional start site (TSS) of the Ephb4 (B) or Coup-TFII (C) gene. Data reanalysed from ETS1 ChIP-seq by |
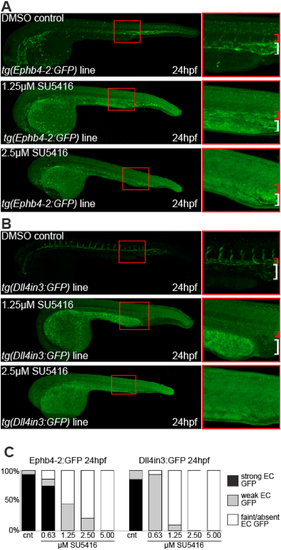
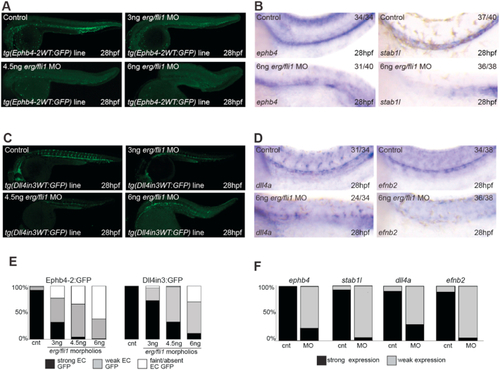
VEGFA signalling is required for both venous and arterial enhancer activity. A-B. Representative 24 hpf venous tg(Ephb4-2:GFP) (A) and arterial/angiogenic tg(Dll4in3:GFP) (B) zebrafish embryos treated with either DMSO control or different concentrations of VEGFR inhibitor SU5416. Red bracket indicates dorsal aorta, white bracket indicates cardinal vein. C. Graph depicting observed GFP expression levels in transgenic embryos treated with DMSO control or different levels of SU5416. Ephb4-2:GFP cnt n = 26, 0.63 μM SU5416 n = 27, 1.25 μM SU5416 n = 72, 2.5 μM SU5416 n = 62, 5 μM SU5416 n = 72. Dll4in3:GFP cnt n = 32, 0.63 μM SU5416 n = 29, 1.25 μM SU5416 n = 31, 2.5 μM SU5416 n = 26, 5 μM SU5416 n = 33. |
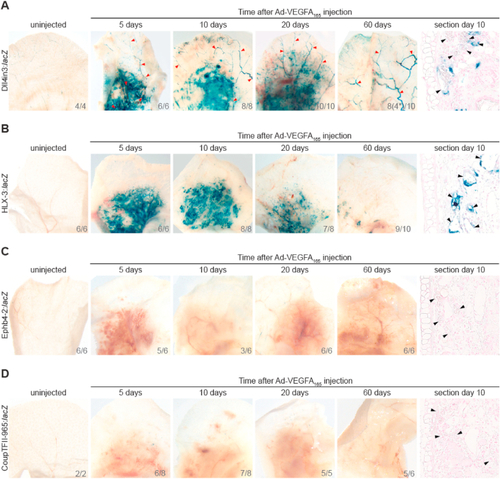
Intradermal injection of Ad-VEGFA164 results in sustained arterial and angiogenic enhancer activity, but venous enhancers were not reactivated. Ad-VEGFA164 was injected intradermally into the ears of adult Foxn1−/− mice transgenic for arterial and angiogenic-expressed Dll4in3: |
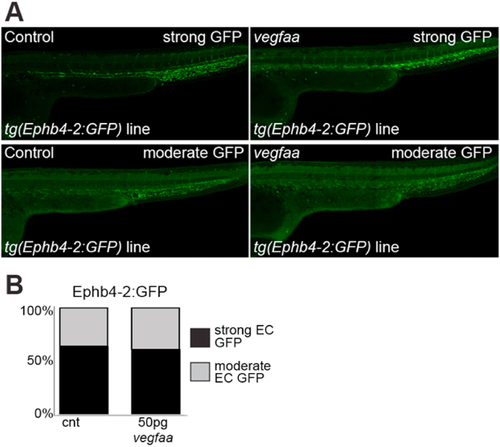
Fig. 7. VEGFA overexpression does not change venous Ephb4-2 enhancer activity during embryonic development in zebrafish. A. Representative 28 hpf control (left panel) or vegfaa mRNA injected (right panel) tg(Ephb4-2:GFP) transgenic embryos show similar levels of expression. B. Graph depicting observed expression pattern of GFP in tg(Ephb4-2:GFP) control and vegfaa mRNA injected transgenic embryos. Black denotes strong venous GFP expression, grey denotes moderate venous GFP expression. Some variability is seen between embryos in both control and injected groups, but the percentage with strong (upper) and moderate (lower) GFP expression remained similar between the two groups. Control n = 164, injected n = 129. More representative embryos can be seen in Figure S13. |
Reprinted from Developmental Biology, 473, Neal, A., Nornes, S., Louphrasitthiphol, P., Sacilotto, N., Preston, M.D., Fleisinger, L., Payne, S., De Val, S., ETS factors are required but not sufficient for specific patterns of enhancer activity in different endothelial subtypes, 1-14, Copyright (2021) with permission from Elsevier. Full text @ Dev. Biol.