FIGURE SUMMARY
Title

The Heparan Sulfate Binding Peptide in Tumor Progression of Triple-Negative Breast Cancer

Authors
Melo, C.M., Wang, H., Fujimura, K., Strnadel, J., Meneghetti, M.C.Z., Nader, H.B., Klemke, R.L., Pinhal, M.A.S.
Source
Full text @ Front Oncol

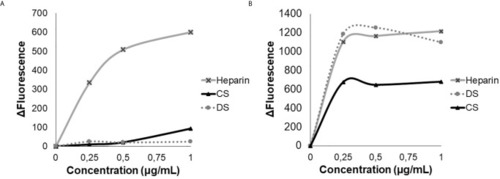
Analysis of tryptophan emission. Heparin, dermatan sulfate (DS) and chondroitin sulfate (CS), were titrated in the presence of 3 µM of HS-binding peptide (A) or in the presence of 3 µM of scrambled peptide (B). Excitation 280 nm, emission 350 nm. The HS- binding peptide interacts only with heparin.

A spectrum obtained by circular dichroism. Circular dichroism was performed to determine the peptide interaction with chemically modified heparins, demonstrating an alteration in the secondary structure of this peptide. Porcine heparin (Hep), Heparin 2-O-sulfated and N-sulfated heparin (Hep2SNS), Heparin 6-O-sulfated and N-sulfated (Hep6SNS), Heparin 2-O-sulfated and 6-O-sulfated (Hep2S6S), Heparin 6-sulfated (Hep6S), Heparin 2-sulfated (Hep2S), and Heparin N-sulfated (HepNS). The heparins that showed the greatest interaction with the peptide were the molecules containing N-sulfation. The assay was performed in the presence of 12 µM of the HS binding peptide and 6.7 µg/ml of each heparin in a 10 mM sodium phosphate solution. Control, 12µM of peptide in 10mM sodium phosphate solution.
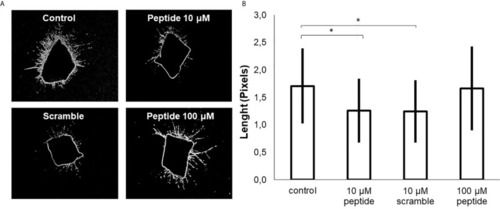
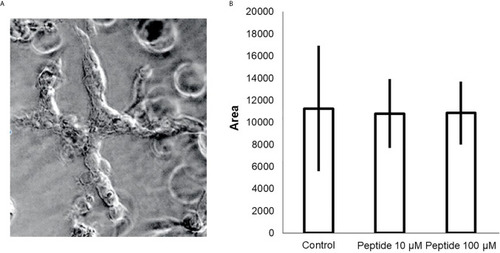
 (A) The lines represent the repeat averages of eight different experimental readings. (B) The percentage of right-twisted antiparallel beta-sheet was analyzed. A reduction from the right-twisted shape to the left-twisted or relaxed shape was observed specifically with N-sulfated heparins.

Angiogenesis in vitro analysis. (A) Cell proliferation assay in the presence of HS-binding peptide. Proliferation assays were performed using BrdU as described in Methods. HUVEC cells were treated with the HS-binding peptide at different doses for 18 hours. After treatment, BrdU was added into the cell culture and luminescence was analyzed. Assay performed in triplicate, the bar represents average and lines represent standard deviation. The proliferation is inhibited from 1 µM of HS-binding peptide and reaches maximum inhibition at 5 µM. *p < 0.05 (Kruskall-Wallis). (B) Tubular formation with endothelial cells. Control, Cells remain in the absence of treatment. Peptide, Cells were treated with the HS-binding peptide (10 µM) for 18 hours. The tubular formation was analyzed by microscopy 20x magnification. (C) Lumen size was measured, the bar represents average and lines represent standard deviation, *p < 0.05 (Kruskall-Wallis). Control, cells remain in the absence of treatment. Peptide, cells were treated with HS-binding peptide (10µM) for 18hours. It was verified that peptide was capable to inhibit the tubular formation of endothelial cells.

Analysis of angiogenesis in vivo. This assay was performed with Tg [Fli1: ​​eGFP] embryos (10 embryos per group). (A) the image of zebrafish embryos. Control, untreated embryos. Peptide, embryos treated with the HS-binding peptide. Scramble, embryos treated with scrambled peptide. Assays were performed with zebrafish embryos 2 days after fertilization (2 dpf). After 24 hours of treatment, the animals were analyzed by confocal microscopy and the images obtained in 10X magnification. Subintestinal vessels were analyzed. (B) the quantification of the subintestinal vessels was evaluated using ImageJ software. The values ​​express the mean and standard deviation in each group. *p < 0.05 (ANOVA). The HS-binding peptide was capable of inhibiting angiogenesis of sub intestinal vessels.

Ex vivo angiogenesis assay. Sixteen rings of mouse aortas were collected and cultured in culture plates containing Matrigel for seven days, (A) aorta ring cultured in the absence of peptide (control); aorta ring cultured in the presence of HS-binding peptide (10 µM or 100 µM) and aorta ring cultured in the presence of scrambled peptide (10 µM). (B) The area of ​​the formed blood vessels was analyzed using ImageJ software. The values represent means and standard deviations the area reached by the blood vessels formed from the aorta. *p < 0.05 (ANOVA). The HS-binding peptide decreased blood formation from the aorta.

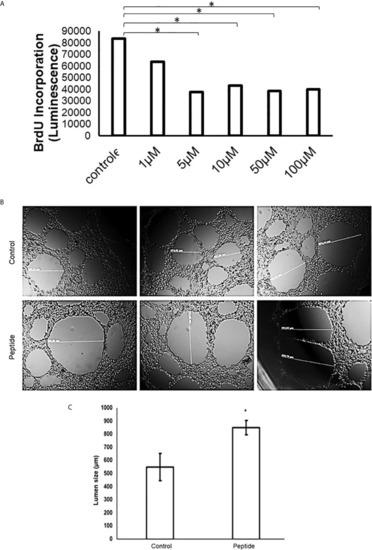
Cell proliferation/viability assay in the presence of growth factors. HUVEC cells were cultured for 50 hours on collagen type 1 in medium containing 2% fetal bovine serum (FBS) and 20 ng/mL FGF-2 or 50 ng/mL VEGF-A, in the presence or absence of the HS-binding peptide. (A) VEGF-A + 2% SFB. (B) FGF-2 + 2% SFB. (C) 2% SFB. Control, HUVEC cells in the absence of treatment. Peptide, HUVEC cells with HS-binding peptide treatment (10 µM). Assay performed in triplicate. The values indicate the mean and standard deviation of the cell index (index proportional to the number of cells adhered to the plate). Peptide inhibited FGF-2 proliferation. Each point of FGF-2 assay was statically significant p<0.05 (Kruskall-Wallis) while the decrease of proliferation/viability with VEGF-A was not significant.

Effect of HS-binding peptide in the 3D culture (spheroid) triple-negative breast cancer. Patient-derived xenotransplant cells (PDX cells) were obtained from tissue collected of a triple negative breast cancer patient. (A) The cells cultured for 14 days. The exchange of culture medium was performed every three days. (B) Cell proliferation and viability analysis were determined by the size of the colonies (area). Measurements were obtained using a Nikon microscope using 10X magnification (Nikon, Minato, Tokyo, Japan). The assay was performed in triplicate. Peptide did not affect triple-negative cells, p>0.05 (Kruskall-Wallis).

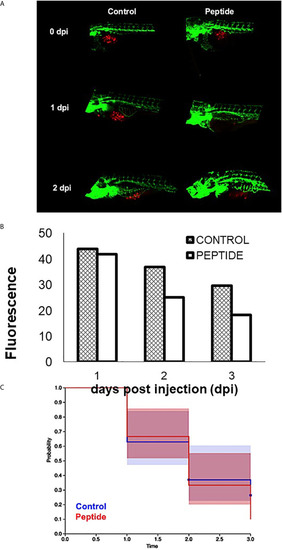
Effect of HS-binding peptide on tumor progression. Approximately 150 PDX cells obtained by surgical resection of a patient with triple-negative breast cancer were labeled with red fluorescent protein (RFP) and injected into the zebrafish embryo yolk sac after 1 day of fertilization (1 dpf). Embryos were incubated for 18 hours, 35.5°C. Peptide, animals were treated with 10 µM HS-binding peptide. Control, animals were not treated. Green; green fluorescent protein (GFP) labeled blood vessels. Red; red fluorescent protein (RFP) labeled tumor cells. (A) Representative images of the control group and the treated group. (B) Quantification of tumor fluorescence (tumor size). The bar represent the average of red fluorescence in zebrafish embryos. (C) Values express percent survival of animals; red line (10 μM of peptide treatment); blue line (animals in the absence of treatment). Each group contains 10 zebrafish embryos. Peptide decreased the number of tumoral cells and increased survival.

Acknowledgments
This image is the copyrighted work of the attributed author or publisher, and ZFIN has permission only to display this image to its users. Additional permissions should be obtained from the applicable author or publisher of the image. Full text @ Front Oncol