
- Title
-
Single-cell imaging of T cell immunotherapy responses in vivo
- Authors
- Yan, C., Yang, Q., Zhang, S., Millar, D.G., Alpert, E.J., Do, D., Veloso, A., Brunson, D.C., Drapkin, B.J., Stanzione, M., Scarfò, I., Moore, J.C., Iyer, S., Qin, Q., Wei, Y., McCarthy, K.M., Rawls, J.F., Dyson, N.J., Cobbold, M., Maus, M.V., Langenau, D.M.
- Source
- Full text @ J. Exp. Med.
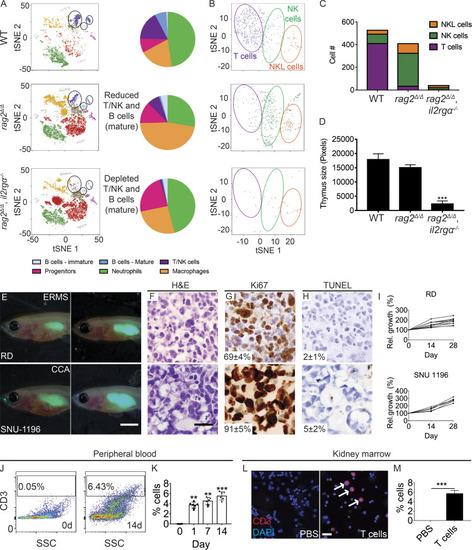
rag2Δ/Δ, il2rga −/− zebrafish have reduced T, B, and NK cells and efficiently engraft human cancer and T cells. (A) tSNE visualization and quantitation of single-cell RNA sequencing of the adult kidney marrow. WT, n = 4,654 cells; rag2Δ/Δ, n = 9,418 cells; and rag2Δ/Δ, il2rga−/−, n = 8,790 cells (n = 3 fish/genotype). (B and C) tSNE visualization subclustering (B) and quantification (C) of T, NK, and NK-lysin+ (NKL) cells within the marrow. (D) Histological analysis of thymus size (n = 5 fish/genotype). (E) Representative images of EGFP+ RD embryonal RMS (ERMS) and SNU-1169 cholangiocarcinoma (CCA) cells just after engraftment (0 dpt, left) and at 28 dpt (right). SNU-1169 failed to efficiently engraft into previous immune-deficient zebrafish models. (F–H) Histology showing H&E (F), Ki67 (G), and TUNEL (H) staining. n ≥ 3 fish/tumor type. (I) Kinetics of tumor growth following successful engraftment. (J–M) Human CD8+ T cells engraft into rag2Δ/Δ, il2rga−/− zebrafish. Flow cytometry analysis of peripheral blood before (left, J) and 14 d after engraftment (right, J). Quantification of human T cells in the peripheral blood (n = 5 fish per time point; K). CD3 immunofluorescence staining of kidney marrow cytospins (CD3+ cells are red and denoted by arrows; DAPI nuclei staining blue; L) and quantification at 14 d after engraftment (n = 6 fish/experimental condition; M). Scale bar equals 0.25 cm (E), 50 µm (F–H), and 10 µm (L). Error bars denote ±SD. **, P < 0.01; ***, P < 0.001, Student's t test compared with controls. Rel., relative; SSC, side scatter. PHENOTYPE:
|

Preclinical evaluation of CAR T cell and BiTE immunotherapies using xenografts grown in rag2Δ/Δ, il2rga −/− zebrafish. (A) Schematic of experimental design. (B–G) CAR T immunotherapy. (H–M) BiTE immunotherapy. (B–F)rag2Δ/Δ, il2rga−/− animals engrafted with GFP+ U87 glioma cells that coexpress EGFRvIII and administered CFSE-labeled untransduced control T cells, CD19 CAR T cells, or EGFRvIII CAR T cells (n ≥ 6 fish/arm). (G) Quantification of relative tumor cell growth following CAR T cell administration in EGFP+ JeKo-1 B cell lymphomas that express endogenous CD19. (H–L)rag2Δ/Δ, il2rga−/− animals engrafted with EGFP+ OVCAR-5 ovarian cancer cells that endogenously express EpCAM and monitored for tumor regressions following injection of CD8+ T cells and either EpCAM control antibody, CD19-CD3 blinatumomab, or EpCAM-CD3 solitomab BiTEs (n ≥ 7 fish/arm). (M) Quantification of relative tumor cell growth following BiTE administration in K562 CML cells engineered to express EGFP and CD19. Merged fluorescence and brightfield images of engrafted animals at 7 dpt (before treatment; left panels in B and H) and 21 dpt (after immunotherapy; right panels in B and H). H&E- (C and I), Ki67- (D and J), and TUNEL-stained (E and K) sections with quantification noted ±SD (n = 3 fish/arm). Waterfall plots quantifying relative tumor growth at 21 dpt with the epitope expressed noted in parenthesis (F, G, L, and M). ***, P < 0.001, Student’s t test compared with control treated fish. Scale bar equals 0.25 cm (B and H) and 50 µm (C–E and I–K). Blin, blinatumomab; CML, chronic myeloid leukemia; Sol, solitomab. |
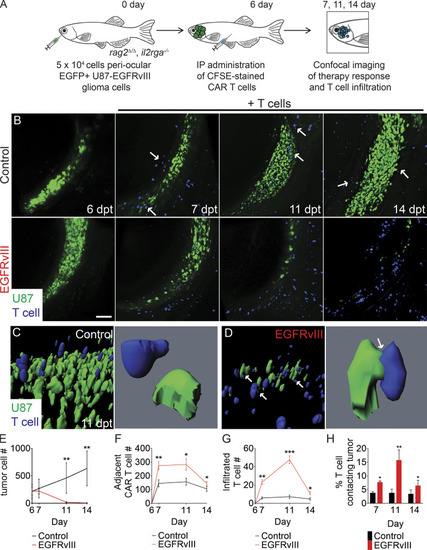
Dynamic single-cell imaging of EGFRvIII CAR T cell infiltration and tumor cell engagement in human glioma xenografts. (A) Schematic of experimental design. (B) Serial imaging of animal engrafted with U87 glioma cells engineered to express EGFP and EGFRvIII into the periocular muscle and imaged before (6 dpt) or after IP injection of CFSE-labeled untransduced T cells or EGFRvIII CAR T cells. Arrows show control T cells aligned on the periphery of the tumor mass. (C and D) 3D modeling of control (C) and EGFRvIII CAR T–treated animals (D) at 11 dpt. Arrows show T cells that directly contact tumor cells. (E) Tumor growth (n = 5 fish/experimental arm, 0.1 mm3 volume). (F and G) Quantification of CAR T cell migration adjacent to the tumor (F) and infiltrated into the tumor (G; n = 5 animals/experimental arm, 0.1 mm3 volume). (H) Quantification of CAR T cells directly contacting tumor cells over time. *, P < 0.05; **, P < 0.01; ***, P < 0.001, Student’s t test. Scale bar equals 100 µm (B) and 10 µm (C and D; lower magnification images). Error bars denote ±SD (E–H). |

Single-cell quantitation of apoptotic immune synapse formation following BiTE immunotherapy in ovarian carcinoma. (A) Schematic of experimental design. (B) Serial imaging of animals engrafted with OVCAR-5 cells engineered to express mCherry and ZipGFP-Casp3 before (6 dpt) and after IP injection of CFSE-labeled CD8+ T cells administered with either EpCAM antibody (control) or EpCAM/CD3 solitomab (7, 11, and 14 dpt; arrows denote apoptotic cells). (C) Quantification of tumor cell numbers in engrafted animals over time. (D) Quantification of apoptotic cells over time. (E) 3D modeling showing control EpCAM antibody (left) or CD3/EpCAM solitomab (right) imaged at 11 dpt (white arrows denote apoptotic cells engaged with T cells). (F) Single-cell renderings showing immune synapse formation in real time. Control (top left panel) and experiment (top right and bottom panels). (G and H) T cell migration to sites adjacent to the tumor (G) and infiltrated into the tumor mass (H; 0.1 mm3 volume). (I) Quantification of the percentage of T cells contacting tumor cells. (J) Number of tumor-infiltrating T cells that contain apoptotic synapses with tumor cells. 0.0125 mm3 volume. *, P < 0.05; **, P < 0.01; ***, P < 0.001, Student’s t test. Scale bar equals 10 µm (B and E). n = 5 fish/experimental arm for all analyses shown. Error bars denote ±SD. Sol, solitomab. |
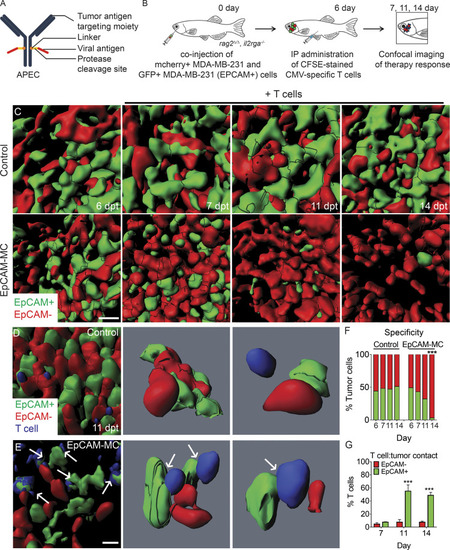
Quantifying APEC immunotherapy responses and target specificity in human breast cancers in vivo. (A) Schematic of APEC antibody. (B) Experimental design. EpCAM−/mCherry+ MDA–MB-231 breast cells compared with those engineered to express EpCAM (EpCAM+/GFP+). (C) 3D volumetric renderings of breast cancer cells engrafted into the periocular musculature (6 dpt, pretreatment) and following IP injection with CMV-specific T cells administered with either control EpCAM antibody (control) or EpCAM-MC (EpCAM). (D and E) High-magnification 3D modeling comparing location of T cells in control (D) and EpCAM-MC–treated animal (E) at 11 dpt. Arrows denote CFSE-stained T cells that directly contact GFP+ tumor cells. (F) Quantification of fluorescent tumor cell number before and after treatment (n > 566 tumor cells/time point, n = 5 animals/condition, 0.1 mm3 volume). (G) Percentage of T cells that directly contacted EpCAM+/GFP+ or EpCAM−/mCherry+ tumor cells (n = 5 animals/condition; error bars denote ±SD, 0.0125 mm3 volume). ***, P < 0.001, χ2 test (F) and Student’s t test (G). Scale bar equals 10 µm (C–E). |

EGFR is expressed in a large fraction of human RMS patients. (A) Venn diagram showing overlap of RMS surface antigens that are currently being investigated in clinical trials for sarcomas. (B) Percentage of RMS patients expressing cell surface epitopes by IHC analysis. (C) IHC immunostaining of EGFR antibody on primary human RMS (four left panels), RD xenografts grown in NSG mice, and normal pediatric skeletal muscle. (D) Percentage of RMS patient samples expressing EGFR based on IHC staining across different subtypes of the disease. (E) Percentage of pediatric and adult RMS patients that express EGFR. *, P < 0.05, χ2 test. (F) Higher EGFR expression correlates with young age (P = 0.05, r = −0.35, linear regression analysis). Pediatric patients of <25 yr of age are shown by red triangles. Scale bar equals 10 µm (C). Ped, pediatric; Rel., relative. |
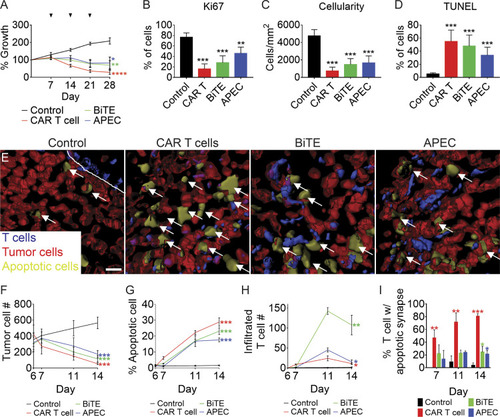
EGFR-specific T cell immunotherapies for the treatment of RMS. (A–D) rag2Δ/Δ, il2rga−/− animals engrafted by IP injection with EGFP+ RD cells and then coadministered weekly (i) control EGFR antibody along with CD8+ T cells, (ii) EGFR CAR T cells, (iii) EGFR/CD3 BiTE with CD8+ T cells, or (iv) EGFR-M14C with CMV-specific CD8+ T cells. Relative growth assessed by whole animal imaging with dosing noted by arrowheads (A). Quantification of proliferation by Ki67 IHC (B), cellularity based on H&E staining (C), and cell apoptosis by TUNEL (D) at 28 dpt. n = 3 animals/condition (B–D). (E–I) 3D modeling of T cell immunotherapy responses in animals engrafted with mCherry+/ZipGFP-Casp3+ RD cells into the periocular muscle imaged at 11 dpt. Control treated T cells (left, E) and T cell immunotherapy (right panels, E). Arrows denote representative examples of apoptotic tumor cells. Quantitation of therapy effects on tumor cell number (F; growth), tumor cell apoptosis (G), T cells infiltrated into tumor mass (H), and percentage of T cells in contact with apoptotic tumor cells (I). n = 5 animals/condition (A and F–I). *, P < 0.05; **, P < 0.01; ***, P < 0.001; ****, P < 0.0001, Student’s t test. Scale bar equals 10 µm (E). Error bars denote ±SD (A–D and F–I). |

EGFR CAR T cells kill human RMS cells in both rag2Δ/Δ, il2rga −/− zebrafish and NSG mouse xenograft models. (A) Quantification of total tumor cell number within each experimental animal (n = 5 fish/experimental arm). (B) Quantification of CAR T cells infiltrated into the tumor mass over time (n = 5 animals/experimental arm). (C) Percentage of T cells that directly contacted RMS tumor cells. (D) Representative luciferase images of RD xenografted tumors in NSG mice (n = 6 mice/experimental arm). (E) Quantification of relative growth of xenografted RD tumors in NSG mice receiving either control CD8+ T cells or EGFR CAR T cells. Arrowheads denote time of CAR T cell administration. *, P < 0.05; **, P < 0.01; ***, P < 0.001, Student’s t test. Error bars denote ±SD (A–C and E). Rh41 and Rh30, fusion-positive RMS; SMS-CTR, fusion-negative RMS. |