
|
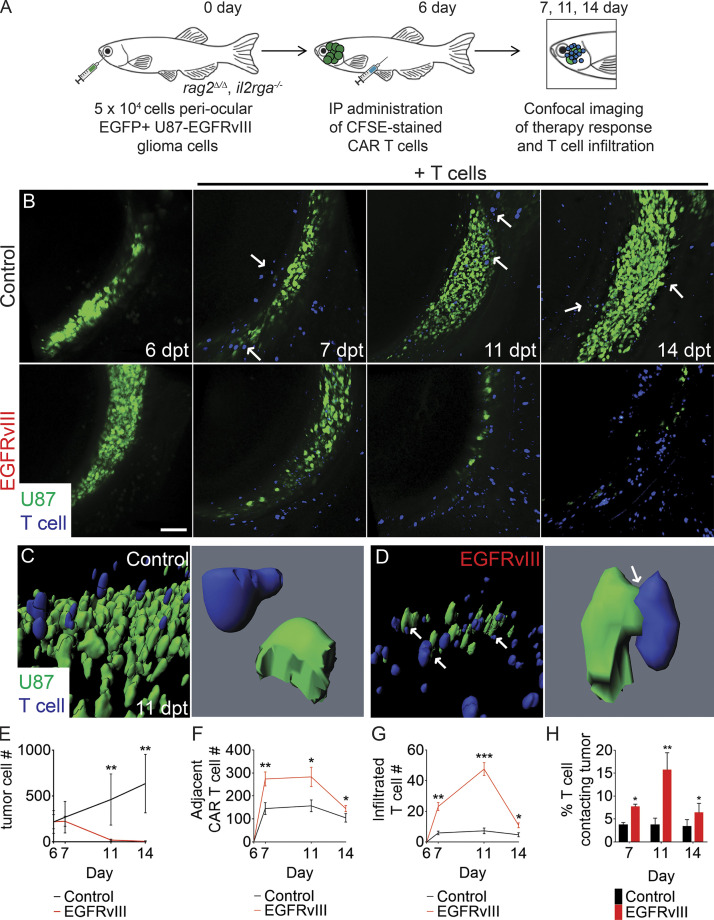
Figure 3.
Dynamic single-cell imaging of EGFRvIII CAR T cell infiltration and tumor cell engagement in human glioma xenografts. (A) Schematic of experimental design. (B) Serial imaging of animal engrafted with U87 glioma cells engineered to express EGFP and EGFRvIII into the periocular muscle and imaged before (6 dpt) or after IP injection of CFSE-labeled untransduced T cells or EGFRvIII CAR T cells. Arrows show control T cells aligned on the periphery of the tumor mass. (C and D) 3D modeling of control (C) and EGFRvIII CAR T–treated animals (D) at 11 dpt. Arrows show T cells that directly contact tumor cells. (E) Tumor growth (n = 5 fish/experimental arm, 0.1 mm3 volume). (F and G) Quantification of CAR T cell migration adjacent to the tumor (F) and infiltrated into the tumor (G; n = 5 animals/experimental arm, 0.1 mm3 volume). (H) Quantification of CAR T cells directly contacting tumor cells over time. *, P < 0.05; **, P < 0.01; ***, P < 0.001, Student’s t test. Scale bar equals 100 µm (B) and 10 µm (C and D; lower magnification images). Error bars denote ±SD (E–H).