
|
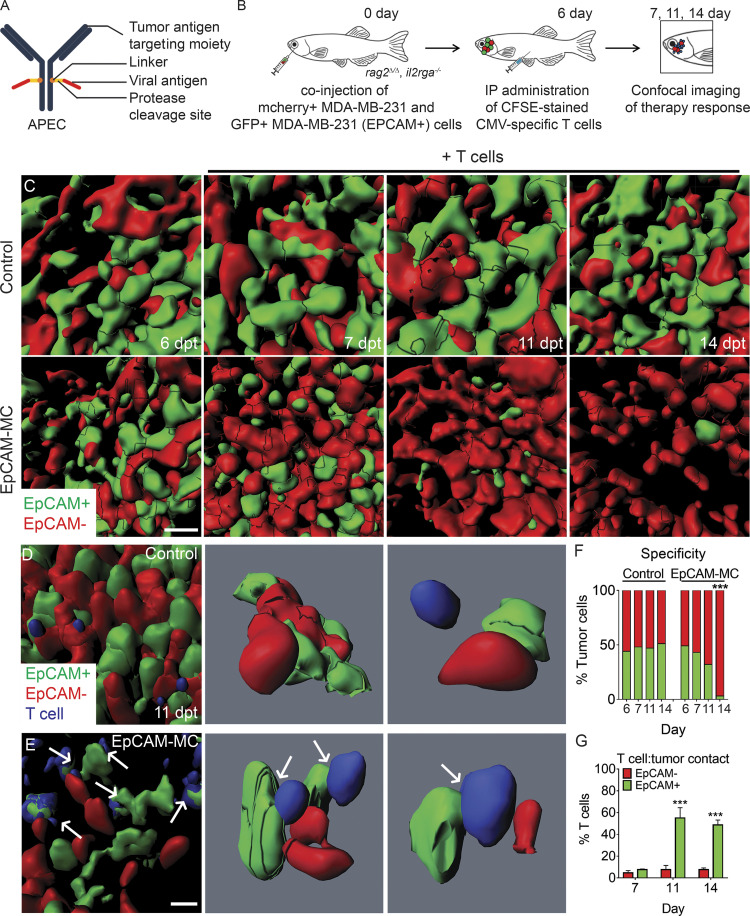
Figure 5.
Quantifying APEC immunotherapy responses and target specificity in human breast cancers in vivo. (A) Schematic of APEC antibody. (B) Experimental design. EpCAM−/mCherry+ MDA–MB-231 breast cells compared with those engineered to express EpCAM (EpCAM+/GFP+). (C) 3D volumetric renderings of breast cancer cells engrafted into the periocular musculature (6 dpt, pretreatment) and following IP injection with CMV-specific T cells administered with either control EpCAM antibody (control) or EpCAM-MC (EpCAM). (D and E) High-magnification 3D modeling comparing location of T cells in control (D) and EpCAM-MC–treated animal (E) at 11 dpt. Arrows denote CFSE-stained T cells that directly contact GFP+ tumor cells. (F) Quantification of fluorescent tumor cell number before and after treatment (n > 566 tumor cells/time point, n = 5 animals/condition, 0.1 mm3 volume). (G) Percentage of T cells that directly contacted EpCAM+/GFP+ or EpCAM−/mCherry+ tumor cells (n = 5 animals/condition; error bars denote ±SD, 0.0125 mm3 volume). ***, P < 0.001, χ2 test (F) and Student’s t test (G). Scale bar equals 10 µm (C–E).