
- Title
-
Gjd2b-mediated gap junctions promote glutamatergic synapse formation and dendritic elaboration in Purkinje neurons
- Authors
- Sitaraman, S., Yadav, G., Agarwal, V., Jabeen, S., Verma, S., Jadhav, M., Thirumalai, V.
- Source
- Full text @ Elife
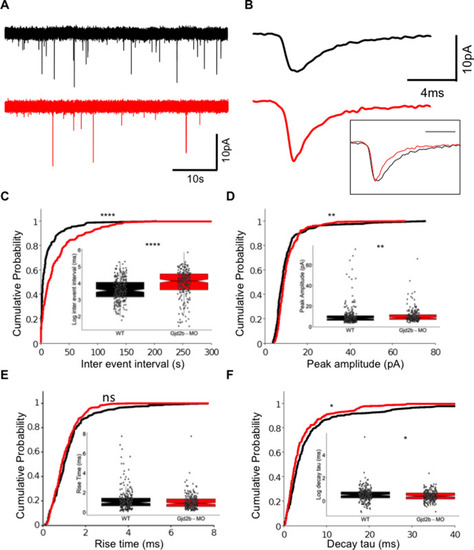
(A) Raw traces of mEPSC recordings from PNs in control (black) and Gjd2b-MO-injected (red) larvae. (B) Average mEPSC waveforms from control and Gjd2b-MO-injected larvae. Inset: scaled mEPSC to show faster decay time of mEPSCs in morphants. Neurons were held at −65 mV. (C–F) Cumulative probability distributions and boxplots of mEPSC inter-event intervals (C), peak amplitudes (D), 10–90% rise times (E), and decay tau (F) in control (black) and Gjd2b-MO-injected (red) larvae. N = 7 cells from 7 larvae from 5 clutches for control and 12 cells from 12 larvae from 8 clutches for the Gjd2b-MO group. **p<0.01; ***p<0.001; ****p<0.0001; Mann–Whitney U test. See also Figure 1—figure supplements 1 and 2. Data used for quantitative analyses are available in Figure 1—source data 1.
|

(A) Genomic region around the start codon (green box) of gjd2b gene was selected for TALEN design, where TALEN-1 recognition sequence (blue line) spans the 5′UTR, the start codon sequence, and a few nucleotides after the start codon. The TALEN-2 recognition sequence (purple line) begins after the 18 nucleotide spacer region. (B) Chromatograms of sequence read from wild-type (WT) and homozygous gjd2bncb215 fish generated in this study indicate an insertion of nucleotide G (red arrowhead) within the Xho1 restriction site (blue line). (C) Representative gel image after Xho1 restriction digestion analysis of an 800 bp amplicon (includes ~300 bp upstream and 500 bp downstream sequences from the point of insertion) shows undigested and partially digested bands in the homozygous and heterozygous mutants, respectively, compared to complete digestion in WT siblings. (D) Predicted amino acid sequences of various gjd2b mutant alleles generated in this study aligned with the WT Gjd2b sequence. gjd2bncb215 is predicted to code for the first six amino acid residues of Gjd2b followed by a nonsense sequence up to the 54th amino acid position. Presence of a premature stop codon terminates translation at this position. (E) Representative images of Gj2b-like immunoreactivity from WT and mutant fish. Staining was not completely abolished as the antibody also recognizes Gjd2a. (F) Gjd2b-like immunoreactivity is reduced in PNs of gjd2bncb215 compared to WT larvae (Mann–Whitney U test; ***p<0.001). Number of images analyzed is indicated in parentheses. Data used for quantitative analyses are available in Figure 2—source data 1.
|
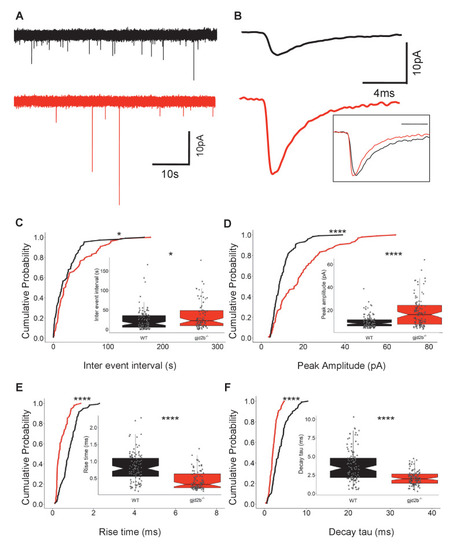
(A) Representative miniature excitatory postsynaptic current (mEPSC) recordings from Purkinje neurons (PNs) of wild-type (black trace) and gjd2b-/- (red) larvae. (B) Average mEPSC shown on expanded time base recorded from wild-type (black) and gjd2b-/- (red) larvae. Neurons were held at −65 mV. Inset: scaled mEPSC to show faster rise time and decay time of mEPSCs in mutants. (C–F) Cumulative probability histograms and boxplots reveal increased inter-event intervals (C), increased peak amplitudes (D), decreased 10–90% rise times (E), and decreased decay time constants (F) of mEPSCs in gjd2b-/- larvae (red lines) compared to wild type (black lines). N = 8 cells in wild type and 10 cells in gjd2b-/- larvae. *p<0.05; ****p<0.0001; Mann–Whitney U test. Data used for quantitative analyses are available in Figure 3—source data 1. See also Figure 3—figure supplement 1.
|

(A) Schematic of experimental setup for stimulating climbing fibers (CFs) while recording EPSCs in Purkinje neurons (PNs; blue). (B) EPSCs recorded at a hyperpolarized holding potential (bottom row traces) and at a depolarized holding potential (top traces) in normal saline (left side traces) and in saline containing the AMPAR blocker CNQX (right-side traces). No EPSCs were detected in the presence of CNQX at −65 or +60 mV at 7 days post fertilization (dpf) (N = 4 cells) or at 19 dpf (N = 2 cells). Data from 19 dpf shown above. (C) Voltage clamp recordings from wild-type (WT) and mutant PNs at 7 dpf at a holding potential of −20 mV show no detectable response to brief pulses (blue bars) of N-methyl-D-aspartate (NMDA). Recordings were done in the presence of 1 µM tetrodotoxin (TTX). (D) Paired pulse depression of EPSCs in PNs of control (black) and Gjd2b-MO-injected (red) larvae. (E) Paired pulse ratios were not significantly different between control and Gjd2b-MO-injected larvae at any of the interstimulus intervals (ISIs) tested (mean ± SD; N = 5 cells from five larvae each in control and Gjd2b-MO groups; two-way repeated-measures ANOVA, p=0.081 for groups [control, Gjd2b-MO] and p<0.001 for ISIs). (F) Paired pulse depression of EPSCs in PNs of WT (black) and gjd2b-/- (red) larvae. (G) Paired pulse ratios were not significantly different between WT and mutant larvae. Mean ± SD; two-way repeated-measures ANOVA, p=0.17 for groups (control, Gjd2b-MO) and p<0.001 for ISI. Data used for quantitative analyses are available in Figure 4—source data 1.
|
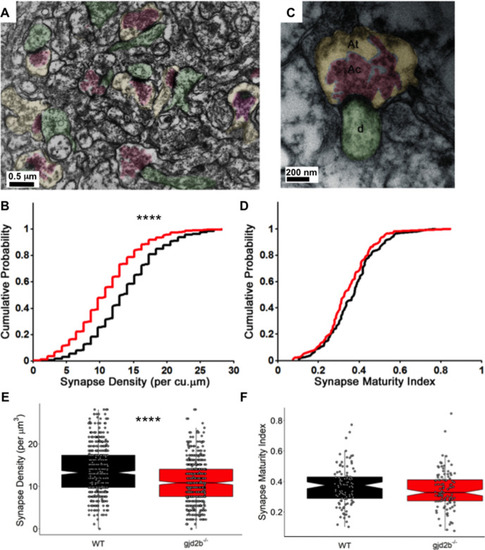
(A) Transmission electron micrograph illustrating synapses identified using clustered vesicles (pink areas) in presynaptic terminals (yellow areas) apposed to postsynaptic density in dendritic profiles (green areas). (B) Cumulative probability plot and (E) boxplot, showing distribution of synapse density per cubic micrometer in wild type (black) and gjd2b-/- larvae (red). 637 micrographs from three wild-type larvae and 550 micrographs from three mutant larvae were analyzed. ****p<0.0001; Mann–Whitney U test. (C) Transmission electron micrograph at high magnification used for quantification of synapse maturation index. The area occupied by clustered vesicles (pink, Ac) was divided by the total area of the presynaptic terminal (yellow, At) to obtain the maturation index. (D) Cumulative probability plot and (F) boxplot, showing the distribution of synapse maturation indices in wild type (black) and gjd2b-/- larvae. 106 micrographs from three larvae each in wild-type and mutant groups were analyzed. p=0.12, Mann–Whitney U test. See also Supplementary file 1. Data used for quantitative analyses are available in Figure 5—source data 1.
|
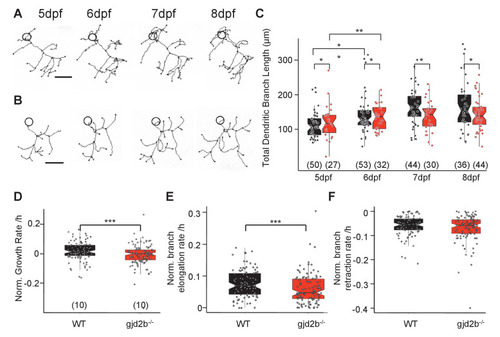
(A) Representative traces of a wild-type (WT) PN from 5 to 8 days post fertilization (dpf). (B) Representative traces of a gjd2b-/- mutant PN from 5 to 8 dpf; scale bar is 10 µm; circle represents the position of the soma and is not to scale. (C) Total dendritic branch length (TDBL) of WT (black) and gjd2b-/- (red) PNs from 5 to 8 dpf. WT and gjd2b-/- neurons show significant growth from 5 to 6 dpf (p=0.0021). WT neurons show significantly higher TDBL values at all days (p=0.048). Statistical comparison was done using a general linear model with an inverse Gaussian error distribution. Post-hoc comparisons were done with the emmeans package in R. (D) Average rate of normalized hourly net branch growth in WT and gjd2b-/- PNs at 6 dpf. Mutant neurons show a significantly reduced rate over 10 hr of observation (p=0.005). (E) Rate of branch elongation in WT and mutant PNs at 6 dpf. Mutant PNs show a significantly reduced rate of branch length elongations (p=0.022). (F) Rate of branch length retractions in WT and mutant PNs at 6 dpf. No significant difference is observed between the two groups (p=0.185). Statistical comparisons in (D–F) were done using general linear models with Gaussian error distribution. Ns (number of neurons sampled) are indicated in parentheses in (C–E). See also Figure 6—figure supplement 1. Data used for quantitative analyses are available in Figure 6—source data 1.
|
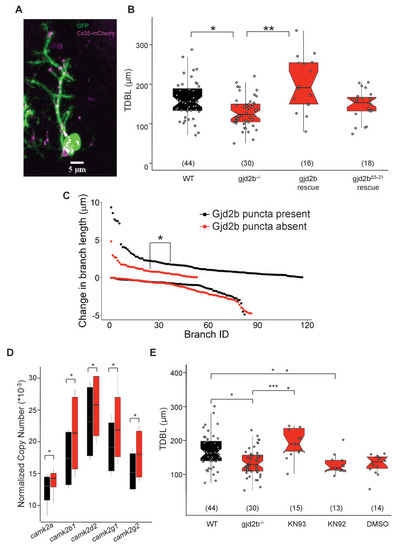
(A) Representative image of a zebrafish PN expressing cytoplasmic GFP (green) and Gjd2b tagged with mCherry (magenta) at 7 days post fertilization (dpf); scale bar is 5 µm. (B) Total dendritic branch length (TDBL) of wild type (WT), gjd2b-/-, gjd2b-rescue, and gjd2bΔ5-21 rescue (pore dead variant) PNs at 7 dpf. TDBL of gjd2b-rescue neurons is significantly increased from that of mutant PNs. TDBL of gjd2bΔ5-21 rescue PNs is not significantly different from that of gjd2b-/- PNs. (C) Change in the lengths of WT PN dendritic branches with and without Gjd2b-mCherry expression. Elongation of branches with Gjd2b is significantly more than branches without (p<0.05). Retraction of branches is similar with and without Gjd2b-mCherry puncta (Mann–Whitney U test; N = 7 neurons). (D) Copy number of CaMKII mRNA in WT and gjd2b-/- larvae. The normalized copy number of CaMKII in the mutant group is significantly higher than the WT group (p<0.05). (E) TDBL of WT, untreated gjd2b-/-, 1 µM KN-93 treated, 1 µM KN-92 treated, and 1% DMSO-treated gjd2b-/- PNs at 7 dpf. TDBL of only KN-93-treated gjd2b-/- PNs are rescued to WT levels (WT vs. KN-93, p=0.23), whereas all other groups are significantly different and lower than WT (Kruskal–Wallis, post-hoc comparison with Mann–Whitney test). Ns (number of neurons sampled) are indicated in parentheses in (B) and (D). See also Figure 7—figure supplement 1 and Supplementary file 2. Data used for quantitative analyses are available in Figure 7—source data 1.
|