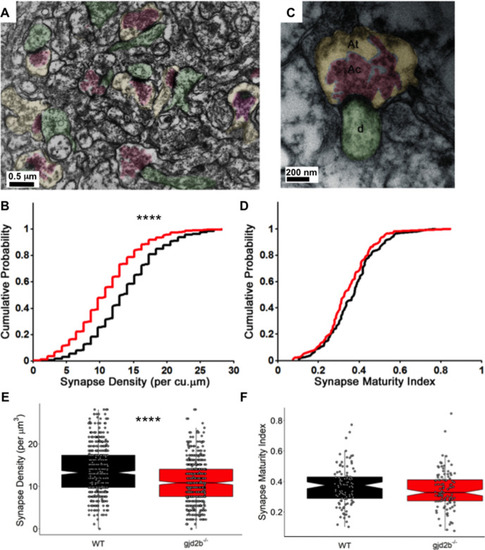
(A) Transmission electron micrograph illustrating synapses identified using clustered vesicles (pink areas) in presynaptic terminals (yellow areas) apposed to postsynaptic density in dendritic profiles (green areas). (B) Cumulative probability plot and (E) boxplot, showing distribution of synapse density per cubic micrometer in wild type (black) and gjd2b-/- larvae (red). 637 micrographs from three wild-type larvae and 550 micrographs from three mutant larvae were analyzed. ****p<0.0001; Mann–Whitney U test. (C) Transmission electron micrograph at high magnification used for quantification of synapse maturation index. The area occupied by clustered vesicles (pink, Ac) was divided by the total area of the presynaptic terminal (yellow, At) to obtain the maturation index. (D) Cumulative probability plot and (F) boxplot, showing the distribution of synapse maturation indices in wild type (black) and gjd2b-/- larvae. 106 micrographs from three larvae each in wild-type and mutant groups were analyzed. p=0.12, Mann–Whitney U test. See also Supplementary file 1. Data used for quantitative analyses are available in Figure 5—source data 1.