
- Title
-
Knockdown screening of chromatin binding and regulatory proteins in zebrafish identified Suz12b as a regulator of tfpia and an antithrombotic drug target
- Authors
- Raman, R., Fallatah, W., Al Qaryoute, A., Dhinoja, S., Jagadeeswaran, P.
- Source
- Full text @ Sci. Rep.

Levels of |
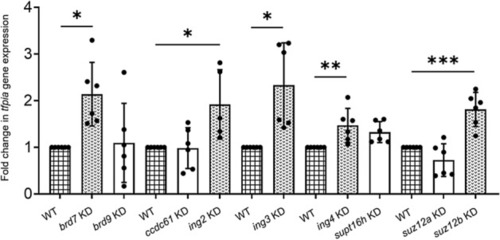
Levels of |

Comparison of time to occlusion of the caudal vein after laser injury between wild-type control 5 dpf larvae and brd7, ing2, ing3, ing4, and suz12b knockdown larvae by one-way ANOVA. The dot plots represent wild-type larvae (closed circles) and the knockdown larvae (closed triangles). Error bars represent mean ± SD. p-value < 0.05 was considered significant, and 50 larvae each were used in control and knockdown experiments (N = 50). The lines on the top represent a significant difference between wild-type and knockdown samples. **** represents p ≤ 0.0001. |
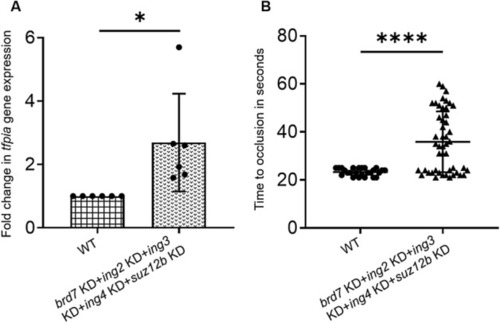
Simultaneous 5-gene knockdowns in adults and larvae. (A) Quantitative real-time PCR showing the fold change of tfpia gene expression in liver and spleen in simultaneous knockdown of 5 chromatin binding and regulatory protein genes, (brd7 + ing2 + ing3 + ing4 + suz12b) with wild-type (WT) controls using Student’s t test. The bar graphs represent wild-type control (squared bar) and simultaneous 5-gene knockdown (dotted bar). Error bars represent mean ± SD. Six fish were used for each of the simultaneous 5-gene knockdown and control experiments (N = 6); (B) Comparison of time to occlusion of the caudal vein after laser injury between wild-type control 5 dpf larvae and simultaneous 5-gene knockdown larvae (brd7 + ing2 + ing3 + ing4 + suz12b) by Student’s t test. The dot plots represent wild-type larvae (closed circles) and the knockdown larvae (closed triangles). Error bars represent mean ± SD. For experiments in (A) and (B), p-value < 0.05 was considered significant, and 50 larvae each were used in control and knockdown experiments (N = 50). The lines on the top represent a significant difference between wild-type and knockdown samples. * and **** represent p ≤ 0.05 and p ≤ 0.0001, respectively. |
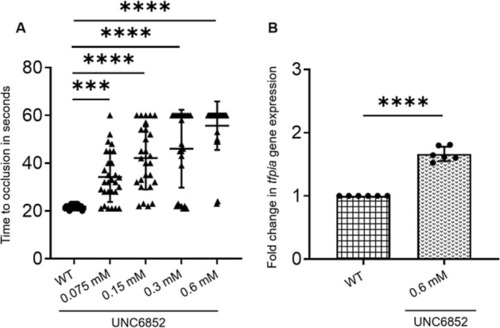
Treatment of zebrafish larvae and adult with a PRC2 inhibitor, UNC6852. (A) Comparison of time to occlusion of the caudal vein after laser injury between wild-type control 5 dpf larvae and UNC6852-injected larvae by one-way ANOVA. The x-axis represents four different concentrations of the UNC6852 (0.075 mM, 0.15 mM, 0.3 mM and 0.6 mM) used for larval injections. The dot plots represent wild-type larvae (closed circles) and the knockdown larvae (closed triangles). Error bars represent mean ± SD. 50 larvae each were used in control and UNC6852 injections (N = 50); (B) Quantitative real-time PCR showing the fold change of tfpia gene expression in liver and spleen for UNC6852-injected adult zebrafish with wild-type control by Student’s t test. The concentration of UNC6852 used for adult injections (0.6 mM) is indicated beneath the bar graph. Error bars represent mean ± SD. Six fish were used for each of the simultaneous 5-gene knockdown and control experiments (N = 6). *** and **** represent p ≤ 0.001 and p ≤ 0.0001, respectively. |