
- Title
-
Oxytocin Signaling Acts as a Marker for Environmental Stressors in Zebrafish
- Authors
- Chuang, H.J., Chang, C.Y., Ho, H.P., Chou, M.Y.
- Source
- Full text @ Int. J. Mol. Sci.

Distribution of oxyr and oxyrl in different tissues of adult zebrafish. The mRNA expression of target genes was analyzed through semi-quantitative PCR; rpl13a was used as an internal control to confirm the cDNA quality of different tissues. |

Charts showing mRNA expression of oxyr and oxyrl in the gills of adult zebrafish acclimated to (A,B) acidic (AC), (C,D) high-ammonia (HA), or (E,F) double-deionized (DI) water for 7 days. Rpl13a was used as an internal control to normalize relative expression. Each circle represents the data of one single fish. The asterisks (*) indicate significant differences between the control and treatment groups. Values are means ± SD (n = 6, p < 0.05 (Student’s t-test)). |

Charts showing mRNA expression of oxyr and oxyrl in the brains of adult zebrafish acclimated to (A,B) AC; (C,D) HA, or (E,F) DI water for 7 days. Rpl13a was used as an internal control to normalize relative expression. Each circle represents the data of one single fish. The asterisks (*) indicate significant differences between the control and treatment groups; ns indicates that no significant difference was found between the control and treatment groups. Values are means ± SD (n = 6, p < 0.05, (Student’s t-test)). |
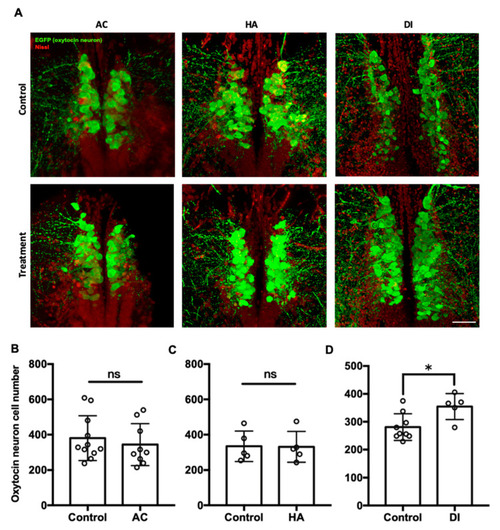
Confocal laser scanning micrographs of the sections of the brain of transgenic zebrafish (oxtl:EGFP) acclimated to AC, HA, or DI water stained with anti-GFP (green; oxytocin) and Nissl (red) (A). Scale bar = 50 µm. The total numbers of oxytocin neurons in the brain of transgenic zebrafish treated with AC (B), HA (C), and DI (D) water were counted through the section sets from whole brain. Each circle represents the data from one single fish. In AC treatment, n = 11 for control group; n = 9 for the treatment group. In HA treatment, n = 5 for both control and treatment group. In DI treatment, n = 9 for control group; n = 5 for the treatment group. The asterisks (*) indicate significant differences between the control and treatment groups; ns indicates that no significant difference was found between the control and treatment groups. Values are mean ± SD (p < 0.05 (Student’s t-test)). |
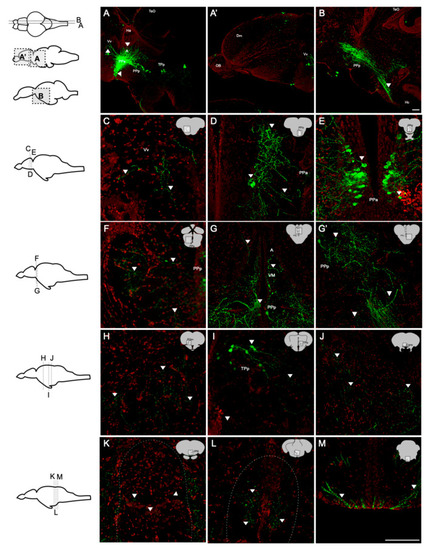
Distribution and projection of oxytocin neurons in the adult zebrafish brain (n = 5). Whole-brain sections were stained with anti-GFP (green; oxytocin) and Nissl (red). (A,B) Sagittal sections showed that the fibers of oxytocin neurons were widely present in the brain. Somas were found in (D,E) PPa, (F,G) PPp, and (I) TPp. From the rostral end to the caudal end, the regions containing the fibers were found in (C) Vv, (D,E) PPa, (F) PPp, (G) A, VM, (H) PGm, (I) TPp, (J) Cans, (K) IPN, (L) raphe, and (M) TTBc. Scale bar = 100 µm. |

Effects of AC, HA, and DI treatments in a novel tank diving test. (A) Schematic of the novel tank diving test. (B) Trajectories of fish moving after exposure to AC, HA, or DI water. (C,E,G) Total moving distance of fish was calculated after exposure to different stressors. (D,F,H) The period fish stayed in upper zone was analyzed after exposure to different stressors. In AC treatment, n = 11 for the treatment group, n = 8 for the treatment group. In HA treatment, n = 9 for control group; n = 11 for the treatment group. In DI treatment, n = 11 for control group; n = 13 for the treatment group. The asterisks (*) indicate significant differences between the control and treatment groups.; ns indicates that no significant difference was found between the control and treatment groups. Values are means ± SD (p < 0.05 (Student’s t-test)). |

Effects of AC, HA, and DI treatments in the mirror biting test. (A) Schematic of the mirror biting test. Adult zebrafish were exposed (B) AC, (C) HA, or (D) DI, and the mirror-biting frequency was determined. Each circle represents the data of one single fish. In AC treatment, n = 11 for control group; n = 10 for the treatment group. In HA treatment, n = 12 for control group; n = 8 for the treatment group. In DI treatment, n = 11 for control group; n = 10 for the treatment group. All the treatments reduced mirror-biting frequency relative to control fish. The asterisks (*) indicate significant differences between the control and treatment groups.; ns indicates that no significant difference was found between the control and treatment groups. Values are means ± SD in (A) and (C) (p < 0.05 (Student’s t-test)). Values are means ± SEM in (B) (p < 0.05 (Mann–Whitney)). |