
- Title
-
Single-cell transcriptome analysis of the zebrafish embryonic trunk
- Authors
- Metikala, S., Casie Chetty, S., Sumanas, S.
- Source
- Full text @ PLoS One

(a) A diagram showing trunk dissection and single cell dissociation followed by single-cell RNA-seq analysis. (b) UMAP plot of 20,279 cells identified a total of 22 different cell clusters. |
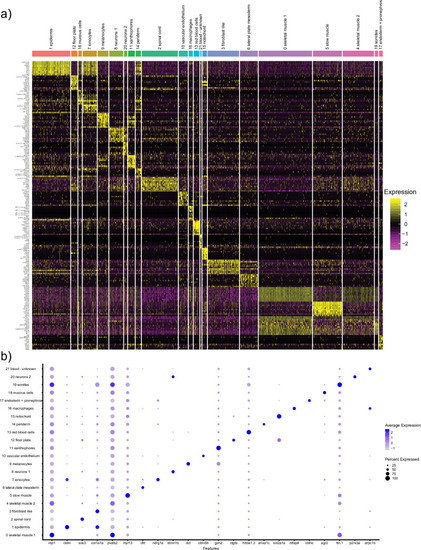
(a) A heatmap showing expression of marker genes expression in different clusters. (b) A dot plot showing the expression of selected genes in different clusters. |
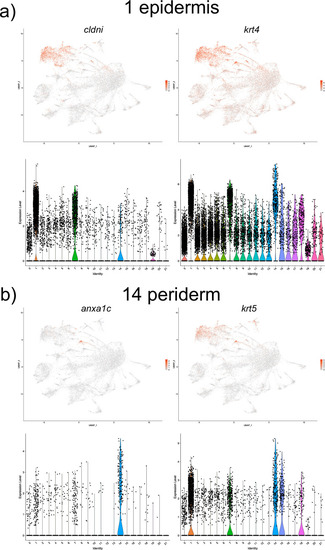
UMAP and violin plots showing the expression of (a) |

UMAP and violin plots showing the expression of selected marker genes for melanocytes (cluster #9, a), ionocytes (cluster #7, b), mucus secreting cells (cluster #18, c), floor plate (cluster #12, d) and xanthophores (cluster #11, e). |
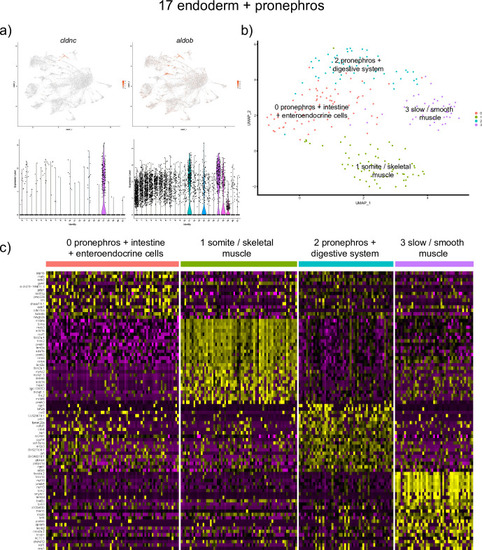
(a) UMAP and violin plots showing the expression of top marker genes, |
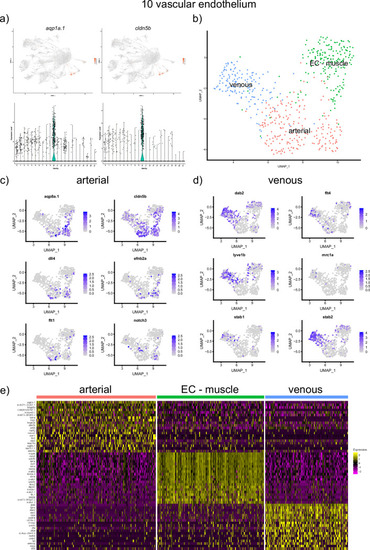
(a) UMAP and violin plots showing the expression of top marker genes, |

UMAP and violin plots showing the expression of selected marker genes for red blood cells, (cluster #13, a), macrophages (cluster #16, b), blood cells of unknown identity (cluster #21, c) and lateral plate mesoderm (cluster #6, d). |
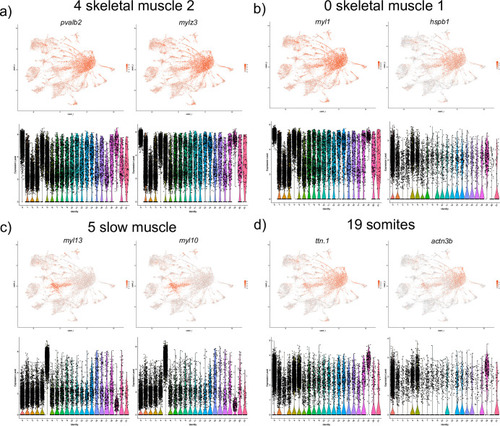
UMAP and violin plots showing the expression of selected marker genes for two skeletal muscle groups (clusters #4 and #0, a,b), slow muscle (cluster #5, c) and somites (cluster #19, d). |
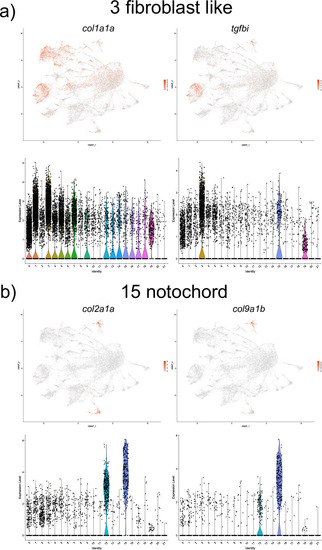
UMAP and violin plots showing the expression of selected marker genes for fibroblast like (cluster #3, a) and notochordal cells (cluster #15, b). |
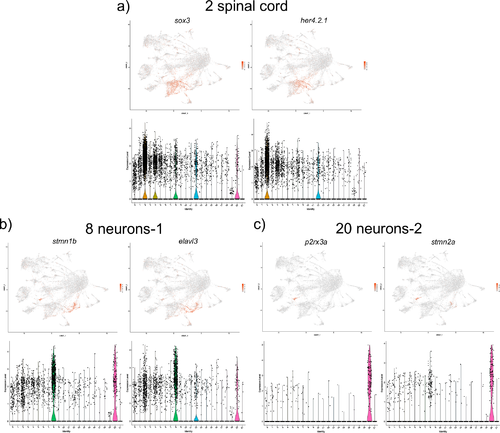
UMAP and violin plots showing the expression of selected marker genes for spinal cord (cluster #2, a), neurons-1 (cluster #8, b) and neurons-2 (cluster #20, c). |