
FIGURE
Fig 10
Fig 10
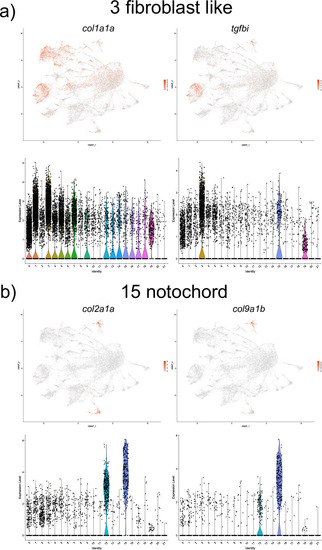
UMAP and violin plots showing the expression of selected marker genes for fibroblast like (cluster #3, a) and notochordal cells (cluster #15, b). |
Expression Data
Expression Detail
Antibody Labeling
Phenotype Data
Phenotype Detail
Acknowledgments
This image is the copyrighted work of the attributed author or publisher, and
ZFIN has permission only to display this image to its users.
Additional permissions should be obtained from the applicable author or publisher of the image.
Full text @ PLoS One