
Image
|
Figure Caption
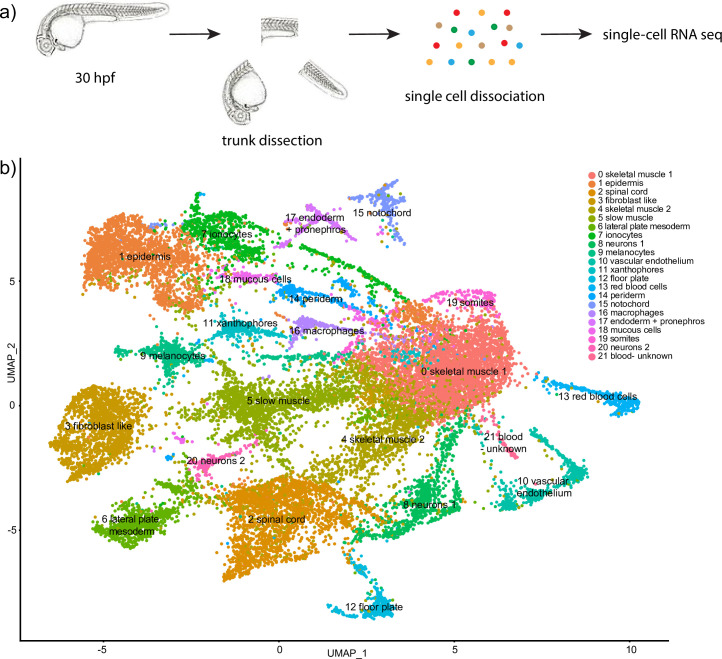
Fig 1
(a) A diagram showing trunk dissection and single cell dissociation followed by single-cell RNA-seq analysis. (b) UMAP plot of 20,279 cells identified a total of 22 different cell clusters.
Acknowledgments
This image is the copyrighted work of the attributed author or publisher, and
ZFIN has permission only to display this image to its users.
Additional permissions should be obtained from the applicable author or publisher of the image.
Full text @ PLoS One