
- Title
-
Leveraging high-throughput screening data, deep neural networks, and conditional generative adversarial networks to advance predictive toxicology
- Authors
- Green, A.J., Mohlenkamp, M.J., Das, J., Chaudhari, M., Truong, L., Tanguay, R.L., Reif, D.M.
- Source
- Full text @ PLoS Comput. Biol.
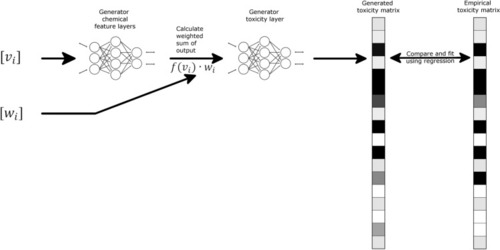
Schematic representation of Go-ZT architecture showing chemical structural input represented as weights (w |
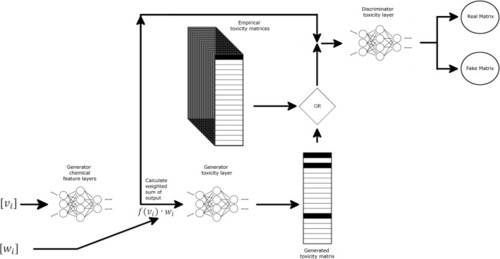
Schematic representation of GAN-ZT architecture showing chemical structural input represented as weights (wi) and views (vi) matrices passed through two fully connected neural networks to produce a predicted toxicity matrix. Chemical features along with predicted or empirical toxicity matrices are then passed to a discriminator comprising a fully-connected neural network. Darker matrix shading indicates higher toxicity values. |
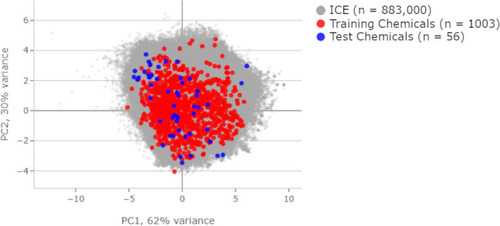
Principal component analysis displayed against the background of over 800,000 chemicals in the Integrated Chemical Environment database. Compares physical chemical properties between the training and test sets. |
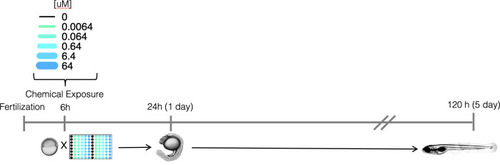
Schematic representation of the experimental approach for screening developmental and neurotoxicity of chemicals in larval zebrafish. |
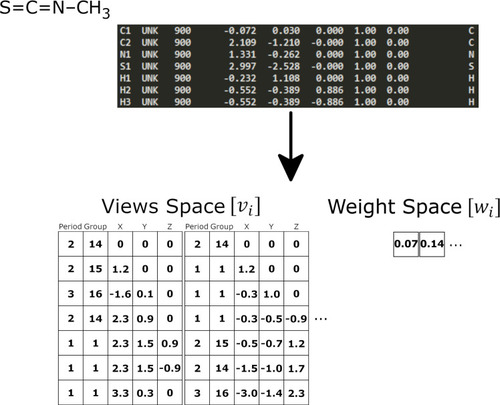
Atom information from the PDB file (shown in grey) in converted into the views and weights matrices. The views space (v |
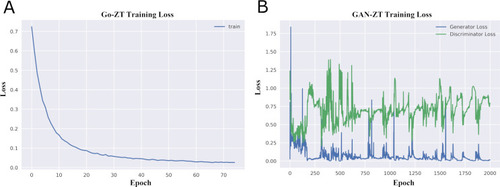
Changes of loss functions during the training of (A) Go-ZT and (B) GAN-ZT. |
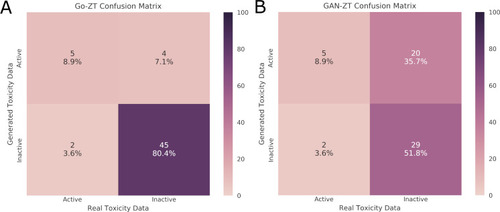
Evaluation of the classification of chemicals in the test data set as either active or inactive using real versus generated toxicity matrices by (A) Go-ZT or (B) GAN-ZT. Color scale represents percent of total chemicals. |
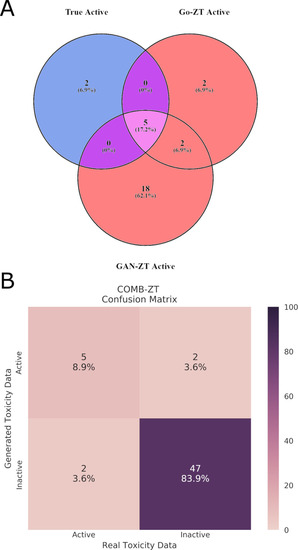
(A)Venn diagram showing the overlap between true active chemicals and chemicals predicted to be active by either Go-ZT or GAN-ZT. (B) A confusion matrix showing the performance of the combined Go-ZT and GAN-ZT models using the test dataset. |