FIGURE

Fig 5

ID
ZDB-FIG-210802-32
Publication
Green et al., 2021 - Leveraging high-throughput screening data, deep neural networks, and conditional generative adversarial networks to advance predictive toxicology
Other Figures
All Figure Page
Back to All Figure Page
Fig 5

Diagram showing the vectorization of Methyl isothiocyanate.

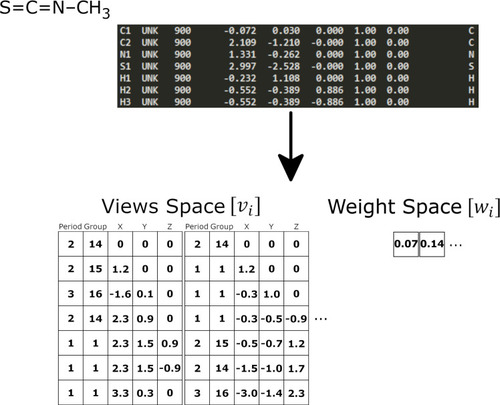
Atom information from the PDB file (shown in grey) in converted into the views and weights matrices. The views space (vi) columns one and two identify the chemical species and correspond to an atom’s position on the periodic table indicating their period and group, respectively. While the last three columns show the relative position of each atom. The weight space (wi) values correspond to each of the views space matrices. In the first views Table C1 is set at the center while in the second view C2 is set at the center of the view. This molecule has nine views, which can be reduced to three views if preference is given only to carbon.

Expression Data

Expression Detail
Antibody Labeling
Phenotype Data

Phenotype Detail
Acknowledgments
This image is the copyrighted work of the attributed author or publisher, and ZFIN has permission only to display this image to its users. Additional permissions should be obtained from the applicable author or publisher of the image. Full text @ PLoS Comput. Biol.