
Image
|
Figure Caption
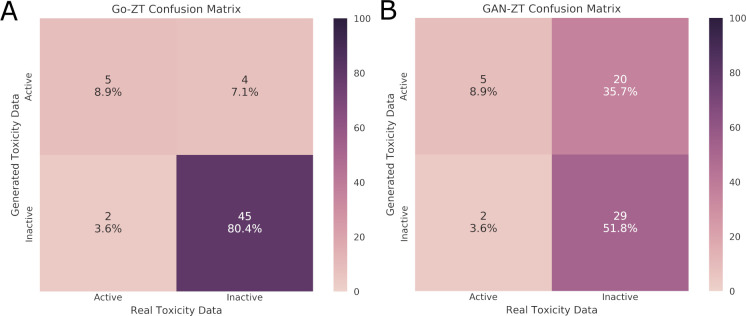
Fig 7
Evaluation of the classification of chemicals in the test data set as either active or inactive using real versus generated toxicity matrices by (A) Go-ZT or (B) GAN-ZT. Color scale represents percent of total chemicals.
Acknowledgments
This image is the copyrighted work of the attributed author or publisher, and
ZFIN has permission only to display this image to its users.
Additional permissions should be obtained from the applicable author or publisher of the image.
Full text @ PLoS Comput. Biol.