
- Title
-
Probiotic Bacteria with High Alpha-Gal Content Protect Zebrafish against Mycobacteriosis
- Authors
- Pacheco, I., Díaz-Sánchez, S., Contreras, M., Villar, M., Cabezas-Cruz, A., Gortázar, C., de la Fuente, J.
- Source
- Full text @ Pharmaceuticals (Basel)
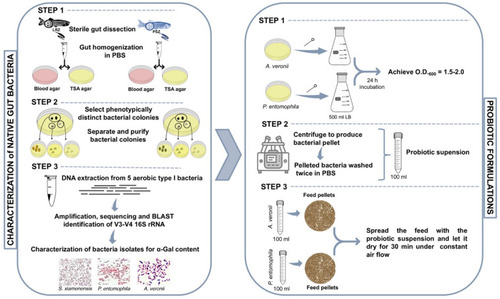
Methodology for the identification and characterization of zebrafish native gut potential probiotic bacteria. Adult female and male wild-type AB laboratory-reared zebrafish (LRZ) and pet-store zebrafish (PSZ) were used for analysis. Potential probiotic bacteria were isolated from the gut or gastrointestinal tract, and bacteria identified with high α-Gal content, namely A. veronii and P. entomophila, were used for probiotic formulations. |

The carbohydrate structure and α-Gal content in potential probiotic bacteria. (A) Density plot representing bacteria that were gated by forward (FSC-H) and side (SSC-H) scatter. (B) Bacteria are represented in a histogram to evaluate the relative α-Gal levels (FL1-H). Cells were incubated with the α-Gal epitope monoclonal antibody M86. FITC-goat anti-mouse IgM-labeled antibodies were used as a secondary antibody. Samples were analyzed on a FAC-Scalibur flow cytometer equipped with CellQuest Pro software v.4. The viable cell population was gated according to forward-scatter (FSC-H) and side-scatter (SSC-H) parameters. (C) The percentage of viable cell population with highest α-Gal content (with mean fluorescence intensity >103 FSC-H; red marks) was compared between different bacteria by one-way ANOVA test (p < 0.005) followed by post hoc Holm multiple comparisons (* p = 0.002, ** p = 0.02, *** p = 0.04, n = 5 biological replicates). (D) The bacterial carbohydrate structure for bacteria identified in the zebrafish microbiota with highest α-Gal content, namely A. veronii and P. entomophila, was characterized by using the Bacterial Carbohydrate Structure Database. The α-Gal was included as reported here in both bacteria. Compound IDs are shown. IUPAC condensed terms are disclosed in Materials and Methods. |

Evaluation of proposed probiotic bacteria in zebrafish. (A) Evaluation of bacterial biosafety. Ten fish per group were injected intraperitoneally with 1 × 10⁶, 1 × 10⁷ and 1 × 10⁸ CFU per fish for both A. veronii and P. entomophila, separately. Fish injected with PBS buffer were used as controls. Bacterial toxicity was evaluated by recording signs and symptoms of infection and mortality of the injected fish daily for 7 days. (B) Experimental design for protective response against M. marinum. The effect of immunization with zebrafish gut candidate probiotic bacteria was evaluated with α-Gal and PBS used as positive and negative controls, respectively. Thirty LRZ were randomly allocated to Group A, commercial diet with probiotic A. veronii; Group B, commercial diet with probiotic P. entomophila; Group C, commercial diet with PBS; and Group D, commercial diet with α-Gal immersion. Fish were weighted at the weeks 1–5 and 10 at the end of the experiment. Gut and sera were collected at weeks 3 (T1), 4 (T2) and 5 (T3) and at the end of the experiment (week 10; T4) and processed for gut and serum collection for analysis of antibody levels by ELISA, mycobacteria levels by RT-qPCR, expression of selected immune response gene markers by RT-qPCR, oxidative stress biomarkers and gut microbiome. |
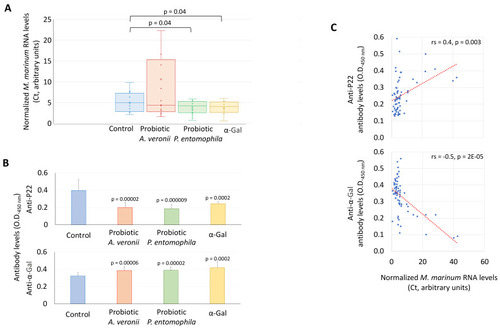
Effect of probiotic treatment and challenge with M. marinum on the zebrafish mycobacterial infection levels and antibody response. (A) Mycobacterium RNA levels were characterized by RT-qPCR in immunized and control PBS zebrafish challenged with M. marinum, normalized against D. rerio gapdh. The normalized Ct values were compared between treated and negative PBS control groups by Student’s t-test with unequal variance (p < 0.05; n = 10–17/group). (B) Anti-α-Gal and P22 IgM antibody titers were characterized by ELISA in immunized and control PBS zebrafish challenged with M. marinum. The o.d. at 450 nm (mean of the duplicate well values of o.d. P22 or α-Gal–o.d. PBS control plus standard deviation, SD) were compared between treated and negative PBS control groups at T4 by Student’s t-test with unequal variance (p < 0.005; n = 12–20/group). (C) Spearman’s Rho correlation analysis between antibody titers and M. marinum infection RNA levels (p < 0.005). |
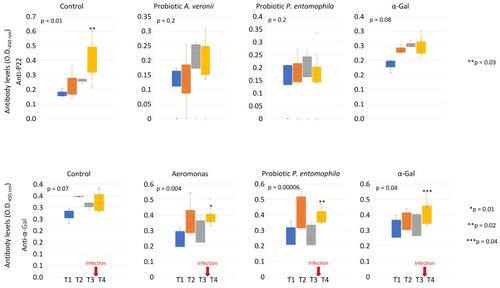
Anti-α-Gal and P22 IgM antibody titers in immunized and control PBS zebrafish challenged with M. marinum. Anti-α-Gal and P22 IgM antibody titers were characterized by ELISA. The o.d. at 450 nm (mean of the duplicate well values of o.d. P22 or α-Gal – o.d. PBS control) was compared between different time points (T1 to T4) by one-way ANOVA test (p < 0.05), followed by post hoc Holm multiple comparisons between T1 and T4 (* p < 0.01, ** p < 0.04, *** p < 0.05, n = 3–20/group). The time of infection challenge with M. marinum is shown with red arrows. |
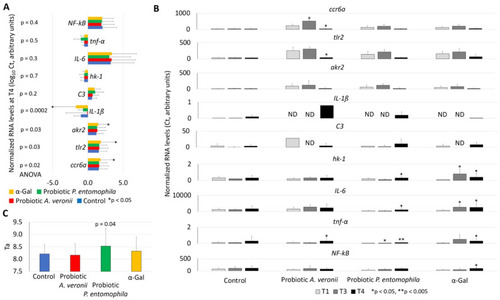
Expression of zebrafish immune-response genes in response to α-Gal and probiotic bacteria. The RT-qPCR was performed for the analysis of gene mRNA levels, using specific primers and conditions (Table 3). (A) The RNA normalized Ct values were compared between groups at T4 (end of the trial) by one-way ANOVA test followed by post hoc Holm multiple comparisons (https://astatsa.com/OneWay_Anova_with_TukeyHSD/; * p < 0.05, n = 3–20/group). (B) The RNA normalized Ct values were compared between T1 and T3/T4 by Student’s t-test with unequal variance (* p < 0.05, ** p < 0.005; n = 12–20/group). Abbreviation: ND, not detected. High-resolution graphs are shown in Supplementary Materials Figure S1. (C) Antioxidant capacity in serum (Ta) was determined by using the potassium permanganate method and Ta values were compared between treated and control groups at T4 by Student’s t-test with unequal variance (p < 0.05; n = 14–20/group). Data are shown as mean + SD. |
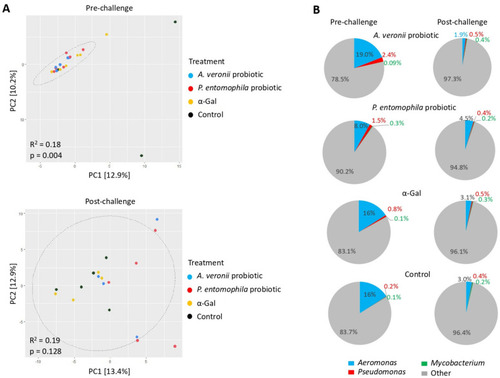
Zebrafish gut microbiota composition in response to probiotic and α-Gal treatments. (A) Principal component analysis of zebrafish gut microbiota grouped by treatment at pre-challenge and post-challenge stages. PCA ordination is based on the Bray–Curtis dissimilarity calculated with randomly rarefied data with no replacement applied to the centered-log transformed clr counts. The percentage of variation is explained by the principal components in the axis, PC1 and PC2. Ellipses indicate 95% confidence intervals. Each point represents one sample, and colors represent treatments/control groups. The closer the points are to one another, the more similar the microbiome composition of the samples are and vice versa. Adonis function in R software was used for PERMANOVA test to evaluate differences between groups. (B) Pie charts display the relative abundance of the genera Aeromonas, Pseudomonas, Mycobacterium and other found on each treatment group at pre-challenge and post-challenge stages. Relative abundance (%) of each genus was calculated from the ASVs raw counts obtained with DADA2 and normalized by total sum scaling. |
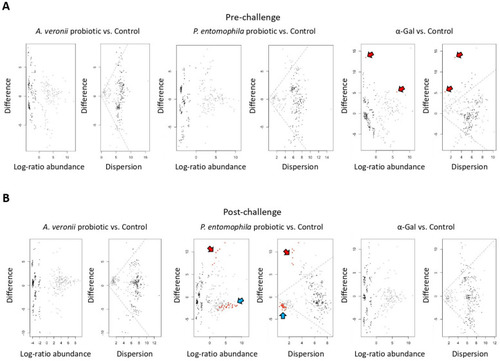
Differential abundance of bacterial taxa in zebrafish gut microbiota. (A) Taxa differential abundance of each treatment group vs. control at pre-challenge stage. (B) Taxa differential abundance of each treatment group vs. control at post-challenge stage. Taxa differential abundance was calculated with ALDEx2 and summarized in the effects size plots. The left MA plots (log-ratio abundance) show the relationship between abundance (log-ratio abundance is the clr value of each feature) on the x-axis and difference on the y-axis. The right plot (dispersion) is an effect plot that shows the relationship between difference and dispersion through the expected value of the log-difference between groups on the y-axis and the maximum within-group dispersion on the x-axis. In both plots, each point represents an individual ASV from the dataset at genus level. Taxa that are not significant are represented by gray or black points. Taxa that are statistically significant are represented by red points (Welch’s test, p < 0.05). Points marked with red arrows are more abundant in α-Gal treatment samples at pre-challenge stage or in P. entomophila probiotic treatment samples at post-challenge stage when compared to controls. Points marked with blue arrows are more abundant in control than in P. entomophila probiotic treatment samples at post-challenge stage. |
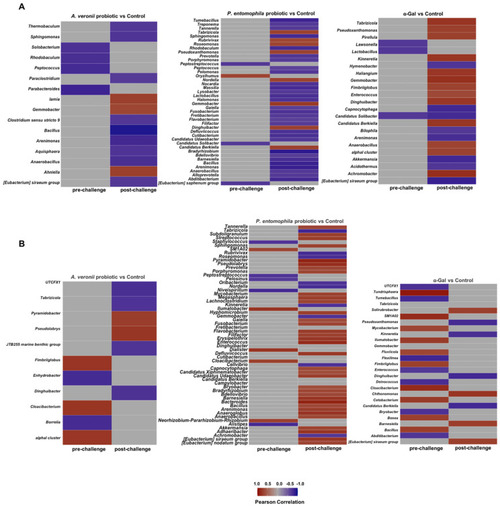
Correlation between zebrafish gut microbiota and antibody response. Heatmaps of the significantly correlated taxa with (A) anti-α-Gal and (B) anti-P22 IgM titers for each experimental group and at each stage (pre-challenge, post-challenge). Pearson correlations between zebrafish gut microbiota and anti-α-Gal and P22 IgM antibody titers were calculated with ALDEx2, using the aldex.corr function analysis, as implemented in R. |
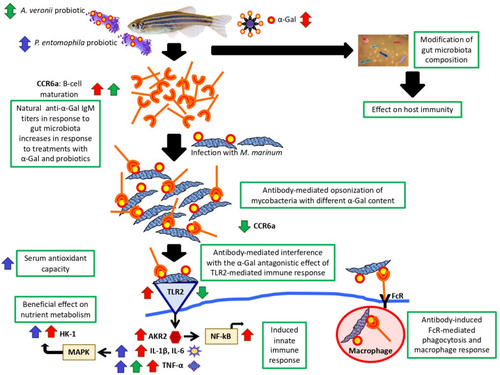
Protective mechanisms activated in response to α-Gal and probiotics with high α-Gal content. Mechanisms regulating immunity and metabolism induced by α-Gal and probiotic bacteria with high α-Gal content included modification of gut microbiota composition, B-cell maturation, anti-α-Gal antibodies-mediated control of mycobacteria, induced innate immune responses, beneficial effects on nutrient metabolism and reduced oxidative stress. Probiotics activated different mechanisms associated with the response to α-Gal. |