
Figure 8
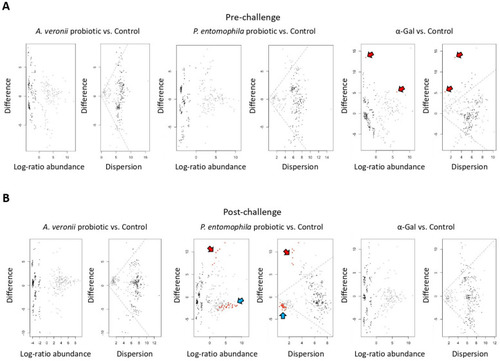
Differential abundance of bacterial taxa in zebrafish gut microbiota. (A) Taxa differential abundance of each treatment group vs. control at pre-challenge stage. (B) Taxa differential abundance of each treatment group vs. control at post-challenge stage. Taxa differential abundance was calculated with ALDEx2 and summarized in the effects size plots. The left MA plots (log-ratio abundance) show the relationship between abundance (log-ratio abundance is the clr value of each feature) on the x-axis and difference on the y-axis. The right plot (dispersion) is an effect plot that shows the relationship between difference and dispersion through the expected value of the log-difference between groups on the y-axis and the maximum within-group dispersion on the x-axis. In both plots, each point represents an individual ASV from the dataset at genus level. Taxa that are not significant are represented by gray or black points. Taxa that are statistically significant are represented by red points (Welch’s test, p < 0.05). Points marked with red arrows are more abundant in α-Gal treatment samples at pre-challenge stage or in P. entomophila probiotic treatment samples at post-challenge stage when compared to controls. Points marked with blue arrows are more abundant in control than in P. entomophila probiotic treatment samples at post-challenge stage. |