
|
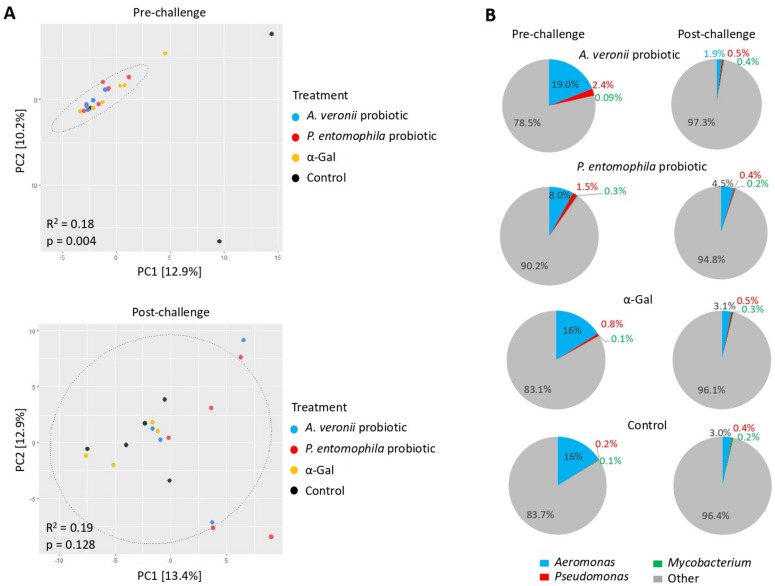
Figure 7 Zebrafish gut microbiota composition in response to probiotic and α-Gal treatments. (A) Principal component analysis of zebrafish gut microbiota grouped by treatment at pre-challenge and post-challenge stages. PCA ordination is based on the Bray–Curtis dissimilarity calculated with randomly rarefied data with no replacement applied to the centered-log transformed clr counts. The percentage of variation is explained by the principal components in the axis, PC1 and PC2. Ellipses indicate 95% confidence intervals. Each point represents one sample, and colors represent treatments/control groups. The closer the points are to one another, the more similar the microbiome composition of the samples are and vice versa. Adonis function in R software was used for PERMANOVA test to evaluate differences between groups. (B) Pie charts display the relative abundance of the genera Aeromonas, Pseudomonas, Mycobacterium and other found on each treatment group at pre-challenge and post-challenge stages. Relative abundance (%) of each genus was calculated from the ASVs raw counts obtained with DADA2 and normalized by total sum scaling.