FIGURE SUMMARY
Title

Melatonin Regulates the Neurotransmitter Secretion Disorder Induced by Caffeine Through the Microbiota-Gut-Brain Axis in Zebrafish (Danio rerio)

Authors
Zhang, Z., Peng, Q., Huo, D., Jiang, S., Ma, C., Chang, H., Chen, K., Li, C., Pan, Y., Zhang, J.
Source
Full text @ Front Cell Dev Biol

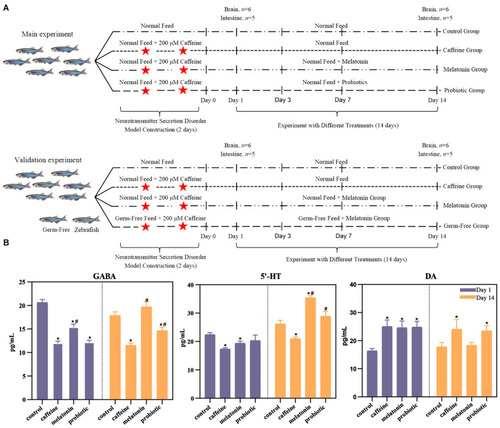
Experimental design and the effects of neural hyperactivity on the levels of neurotransmitters (DA, γ-GABA, and 5-HT) in the zebrafish brain. (A) Experimental design. In the main experiment, the fish were divided into four groups. The control group was treated with normal feed and regular filtered water throughout the experiment. The caffeine, melatonin, and probiotic groups were subjected to two consecutive days of caffeine exposure and then maintained under the corresponding conditions (caffeine group: normal feed + regular filtered water, melatonin group: normal feed + filtered water with 1 μM melatonin, probiotic group: feed containing 8.0 log10 Lactobacillus plantarum HNU082/g of feed + regular filtered water). On days 1 and 14 after caffeine induction, the brain and intestine of each zebrafish were collected for neurotransmitter level determination and high-throughput sequencing, respectively. For the verification experiment, the study added the GF zebrafish groups, and the experimental design and feed conditions were the same as the main experiment. (B) Effects of neural hyperactivity on the levels of neurotransmitters (DA, γ-GABA, 5-HT) in the zebrafish brain; the variation in the secretion levels of neurotransmitters in response to melatonin and probiotic supplementation were determined by ELISA. Mann-Whitney test was used to assess the differences in neurotransmitter levels in the zebrafish brain on days 1 and 14. *p < 0.05 compared with the control group. #p < 0.05 compared with the caffeine group.

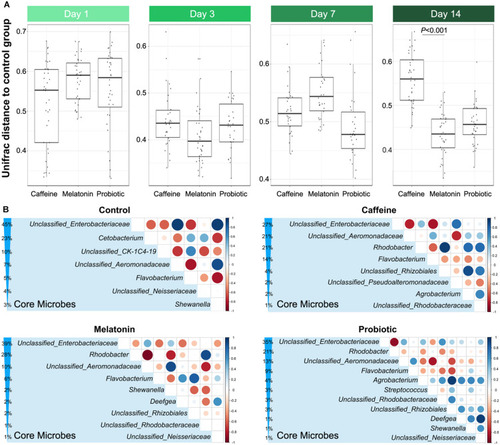
Comparison of similarities and core genera between groups. (A) The distance based on the unweighted UniFrac between the control and three different treatment groups displays the difference of the gut microbiota among different groups on days 1, 3, 7, and 14, which include control vs. caffeine, control vs. melatonin, and control vs. probiotic. (B) Comparative analysis of core genera accounting for more than 1% in the control, caffeine, melatonin, and probiotic groups after 14 days of corresponding treatment. The percentage indicates the relative abundance of the corresponding genus. The size and color of the circle are proportional to the correlation intensity. The redder the color, the stronger the negative correlation, and the bluer the color, the stronger the positive correlation.

Screening of differential genera in the caffeine group, melatonin group, and probiotic group compared with the control group on days 1 and 14. (A) The significant difference genera were screened in the caffeine group, melatonin group, and probiotic group compared with the control group on day 1. (B) The significant difference genera were screened in the caffeine group, melatonin group, and probiotic group compared with the control group on day 14. The depth degree of color represents the relative abundance of the genus or species (The blue indicates a small number and the red indicates a large number). Mann-Whitney test was used on days 1 and 14.

Differential functional features of the zebrafish intestinal microbiota in the caffeine, melatonin, probiotic, and control groups after 14 days of corresponding treatment. Metabolic pathway analysis was performed based on the shotgun metagenomic sequencing data, which were compared with the KEGG database to further explain the microbial metabolic pathways. (A) Metabolic pathway relative abundance. (B) Microbial metabolic pathway analysis between Caffeine and Melatonin group on day 14, Z scores >1.6 were selected as significant differences.

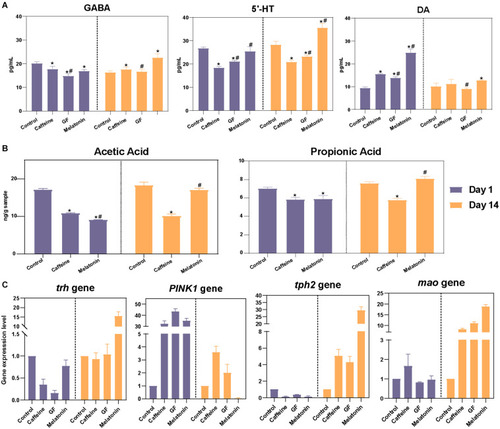
Correlation analysis of neurotransmitter levels in validation experiments. (A) Further verification was performed using germ-free zebrafish, and the levels of neurotransmitters in the zebrafish brain, including DA, γ-GABA, and 5-HT, were detected on days 1 and 14 among the control, caffeine, GF, and melatonin groups. (B) GC-MS analysis of intestinal acetic acid and propionic acid concentrations in zebrafish and contents are expressed as nanograms per gram of intestine. (C) The zebrafish genes associated with DA (PINK1), γ-GABA (trh), and 5-HT (tph2 and mao) secretion were selected and subjected to real-time PCR analysis.

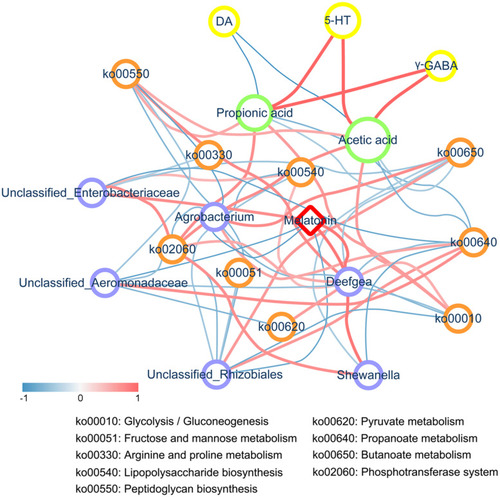
Correlation network analysis. The correlation network constructed among melatonin, differentially abundant genera, metabolic pathways, SCFAs, and neurotransmitters (including DA, γ-GABA, and 5-HT) based on Spearman’s rank correlation coefficient. An R< -0.4 or > 0.4 was selected. The width and color (the red indicates a positive correlation, while the blue indicates a negative correlation) of the edge are proportional to the correlation intensity. The red node represents melatonin, blue nodes represent genera, orange nodes represent metabolic pathways, green nodes represent SCFAs, and yellow nodes represent neurotransmitters. The node size is proportional to the mean abundance in the respective population.

Acknowledgments
This image is the copyrighted work of the attributed author or publisher, and ZFIN has permission only to display this image to its users. Additional permissions should be obtained from the applicable author or publisher of the image. Full text @ Front Cell Dev Biol