FIGURE

FIGURE 6

ID
ZDB-FIG-210611-73
Publication
Zhang et al., 2021 - Melatonin Regulates the Neurotransmitter Secretion Disorder Induced by Caffeine Through the Microbiota-Gut-Brain Axis in Zebrafish (Danio rerio)
Other Figures
All Figure Page
Back to All Figure Page
FIGURE 6

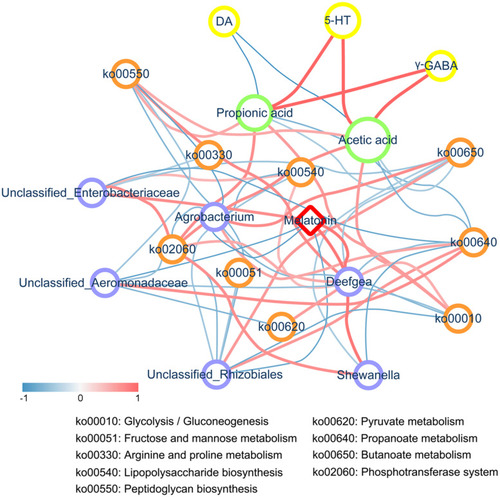
Correlation network analysis. The correlation network constructed among melatonin, differentially abundant genera, metabolic pathways, SCFAs, and neurotransmitters (including DA, γ-GABA, and 5-HT) based on Spearman’s rank correlation coefficient. An R< -0.4 or > 0.4 was selected. The width and color (the red indicates a positive correlation, while the blue indicates a negative correlation) of the edge are proportional to the correlation intensity. The red node represents melatonin, blue nodes represent genera, orange nodes represent metabolic pathways, green nodes represent SCFAs, and yellow nodes represent neurotransmitters. The node size is proportional to the mean abundance in the respective population.

Expression Data

Expression Detail
Antibody Labeling
Phenotype Data

Phenotype Detail
Acknowledgments
This image is the copyrighted work of the attributed author or publisher, and ZFIN has permission only to display this image to its users. Additional permissions should be obtained from the applicable author or publisher of the image. Full text @ Front Cell Dev Biol