IMAGE

FIGURE 3

ID
ZDB-IMAGE-210611-44
Source
Figures for Zhang et al., 2021
Image
Figure Caption

FIGURE 3

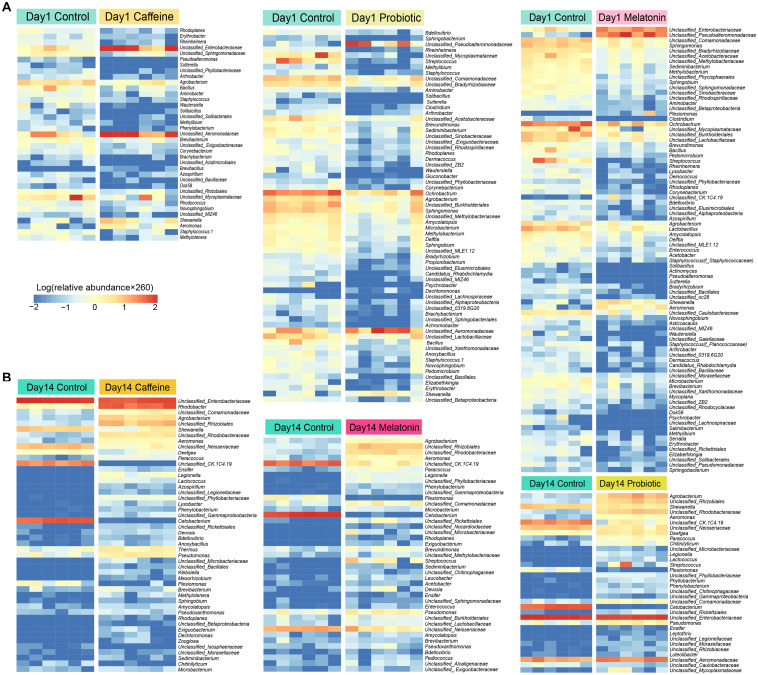
Screening of differential genera in the caffeine group, melatonin group, and probiotic group compared with the control group on days 1 and 14. (A) The significant difference genera were screened in the caffeine group, melatonin group, and probiotic group compared with the control group on day 1. (B) The significant difference genera were screened in the caffeine group, melatonin group, and probiotic group compared with the control group on day 14. The depth degree of color represents the relative abundance of the genus or species (The blue indicates a small number and the red indicates a large number). Mann-Whitney test was used on days 1 and 14.

Acknowledgments
This image is the copyrighted work of the attributed author or publisher, and ZFIN has permission only to display this image to its users. Additional permissions should be obtained from the applicable author or publisher of the image. Full text @ Front Cell Dev Biol