
- Title
-
Leptin receptor-deficient (knockout) zebrafish: effects on nutrient acquisition
- Authors
- Del Vecchio, G., Murashita, K., Verri, T., Gomes, A.S., Rønnestad, I.
- Source
- Full text @ Gen. Comp. Endocrinol.

Generation of the lepr knockout (lepr−/−) line. (A) CRISPR/Cas9 was used to target a 20-base pair (bp) region of exon eight in the zebrafish lepr gene. (B) The frameshifted lepr mutant yielded a truncated protein, due to an additional region of altered translation in which a stop codon was generated upstream the functionally important Ig-like C2-type domain of the lepr gene. The domains were estimated from human LEPR (GenBank Acc. No. AAA93015). |

Oxygen uptake in lepr−/− vs. wt embryos/early larvae at 22 (A), 28 (B) and 34 (C) °C from 3 to 120 hpf (endogenous feeding period). Each time-point is the mean of 6 vials, each containing 10 embryos (±SE). Two-way ANOVA shows significant effect of developmental age [F (5, 53) = 115.2; p < 0.0001] but not genotype [F (1, 53) = 3.342; p > 0.05] at 22 °C; significant effect of developmental age [F (5, 56) = 201.1; p < 0.0001] but not genotype [F (1, 56) = 2.779; p > 0.05] at 28 °C; significant effect of developmental age [F (5, 54) = 164.7; p < 0.0001] but not genotype [F (1, 54) = 2.102; p > 0.05] at 34 °C. A post-hoc Turkey’s multiple comparison was used to assess specific pairwise differences (* = p < 0.05). |
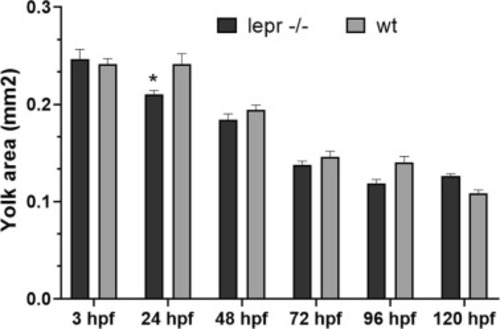
Comparison of the yolk-sac area between lepr−/− and wt embryos/early larvae from 3 to 120 hpf (endogenous feeding period). Each time-point is the mean of 10–15 embryos (±SE). Two-way ANOVA shows significant effects of developmental age [F (5, 152) = 134.5; p < 0.0001] and genotype [F (1, 152) = 4.748; p < 0.05]. A post-hoc Turkey’s multiple comparison was used to assess specific pairwise differences (* = p < 0.05). |

(A) Comparison of oxygen uptake between lepr−/− and wt larvae at 28 °C from 5 to 19 dpf (exogenous feeding period). Each time-point is the mean of 6 vials, each containing 8–10 larvae (±SE). (B) Comparison of oxygen uptake/wet weight between lepr−/− and wt juveniles at 28 °C from 26 to 40 dpf (exogenous feeding period). Each time-point is the mean of 15 vials, each containing 1 juvenile (±SE). The number of fish per vial was chosen according to age and size. Two-way ANOVA shows significant effects of developmental age [F (2, 29) = 66.45; p < 0.0001] and genotype [F (1, 29) = 7.606; p < 0.01] for oxygen uptake in the 5–19 dpf range and significant effects of developmental age [F (2, 79) = 4.27; p < 0.05] and genotype [F (1, 79) = 16.29; p < 0.0001] for oxygen uptake/wet weight in the 26–40 dpf range. A post-hoc Turkey’s multiple comparison was used to assess for specific pairwise differences (*** = p < 0.001). For detailed information see Supplementary Table 2. |

(A) Comparison of the standard length between lepr−/− and wt larvae/juveniles from 5 to 40 dpf (exogenous feeding period). (B) Comparison of the wet weight between lepr−/− and wt juveniles from 26 to 40 dpf (exogenous feeding period). Each time-point is the mean of 10–15 fish (±SE). Two-way ANOVA shows significant effects of developmental age [F (5, 145) = 289.3; p < 0.0001] and genotype [F (1, 145) = 17.47: p < 0.0001] for standard length and a significant effect of developmental age [F (2, 84) = 50.45; p < 0.0001], but not genotype [F (1, 84) = 0.6449; p > 0.05] for wet weight. A post-hoc Turkey’s multiple comparison was used to assess for specific pairwise differences (** = p < 0.01). |
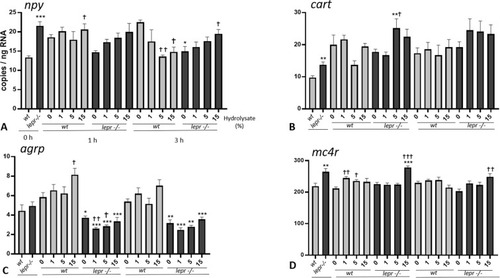
(A-D). Effect of lactalbumin hydrolysate administration on appetite related genes in larval head (8 dpf). Values are mean ± SE (n = 8). Differences in tube-feeding test with respect to the values on the 0% hydrolysate group (indicated by †) within each zebrafish line (lepr−/−or wt) were assessed by one-way ANOVA. Differences between the lines at each sampling time (indicated by *) were assessed by two-way ANOVA. Two-way ANOVA shows no significant effects of concentration [F (3, 55) = 2.311; p > 0.05] and genotype [F (1, 55) = 2.956; p > 0.05] at 1 h and no significant effects of concentration [F (3, 55) = 1.466; p > 0.05] and genotype [F (1, 55) = 0.004; p > 0.05] at 3 h for npy; no significant effects of concentration [F (3, 56) = 0.4654; p > 0.05] and genotype [F (1, 56) = 1.874; p > 0.05] at 1 h and no significant effect of concentration [F (3, 56) = 0.6222; p > 0.05] but significant effect of genotype [F (1, 56) = 6.588; p < 0.05] at 3 h for cart; significant effects of concentration [F (3, 56) = 3.010; p < 0.05] and genotype [F (1, 56) = 118.6; p < 0.0001] at 1 h and significant effects of concentration [F (3, 56) = 3.735; p < 0.05] and genotype [F (1, 56) = 100.4; p < 0.0001] at 3 h for agrp; significant effect of concentration [F (3, 56) = 14.43; p < 0.0001] but no significant effect of genotype [F (1, 56) = 2.571; p > 0.05] at 1 h and no significant effects of concentration [F (3, 56) = 1.912; p > 0.05] and genotype [F (1, 56) = 0.6626; p > 0.05] at 3 h for mc4r. A Dunnett’s multiple comparison test for one-way ANOVA and a post-hoc Turkey’s multiple comparison were used to assess for specific pairwise differences (*, † = p < 0.05; **, †† = p < 0.01 and ***, ††† = p < 0.001). |
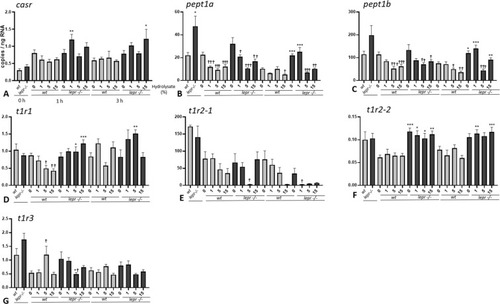
(A-G). Effect of lactalbumin hydrolysate administration on nutrient-sensing related genes in larval trunk (8 dpf). Values are mean ± SE (n = 8). Differences in tube-feeding test with respect to the values on the 0% hydrolysate group (indicated by †) within each zebrafish line (lepr−/−or wt) were assessed by one-way ANOVA. Differences between the lines at each sampling time (indicated by *) were assessed by two-way ANOVA. Two-way ANOVA shows no significant effect of concentration [F (3, 53) = 2.292; p > 0.05] but significant effect of genotype [F (1, 53) = 14.30; p < 0.0001] at 1 h, and no significant effect of concentration [F (3, 54) = 0.9335; p > 0.05] but significant effect of genotype [F (1, 54) = 11.70; p < 0.01] at 3 h for casr; significant effects of concentration [F (3, 56) = 12. 14; p < 0.0001] and genotype [F (1, 56) = 7.005; p < 0.05] at 1 h and significant effects of concentration [F (3, 56) = 13.92; p < 0.0001] and genotype [F (1, 56) = 35.26; p < 0.0001] at 3 h for pept1a; significant effect of concentration [F (3, 56) = 10.91; p < 0.0001], but not genotype [F (1, 56) = 3.658; p > 0.05] at 1 h and significant effects of concentration [F (3, 56) = 20.15; p < 0.0001] and genotype [F (1, 56) = 42.18; p < 0.0001] at 3 h for pept1b; no significant effect of concentration [F (3, 56) = 0.5851; p > 0.05], but significant effect of genotype [F (1, 56) = 26.76; p < 0.0001] at 1 h and no significant effects of concentration [F (3, 55) = 2.728; p > 0.05] and genotype [F (1, 55) = 2.754; p > 0.05] at 3 h for t1r1; no significant effects of concentration [F (3, 52) = 2.435; p > 0.05] and genotype [F (1, 52) = 0.5828; p > 0.05] at 1 h and significant effects of concentration [F (3, 49) = 3.988; p < 0.05] and genotype [F (1, 49) = 8.861; p < 0.01] at 3 h for t1r2-1; no significant effect of concentration [F (3, 56) = 0.2170; p > 0.05] but significant effect of genotype [F (1, 56) = 64.26; p < 0.0001] at 1 h and no significant effect of concentration [F (3, 54) = 0.1986; p > 0.05] but significant effect of genotype [F (1, 54) = 43.93; p < 0.0001] at 3 h for t1r2-2; no significant effects of concentration [F (3, 53) = 0.7686; p > 0.05] and genotype [F (1, 53) = 1.129; p > 0.05] at 1 h and no significant effects of concentration [F (3, 55) = 1.748; p > 0.05] and genotype [F (1, 55) = 1.063; p > 0.05] at 3 h for t1r3. A Dunnett’s multiple comparison test for one-way ANOVA and a post-hoc Turkey’s multiple comparison were used to assess for specific pairwise differences (*, † = p < 0.05; **, †† = p < 0.01 and ***, ††† = p < 0.001). |
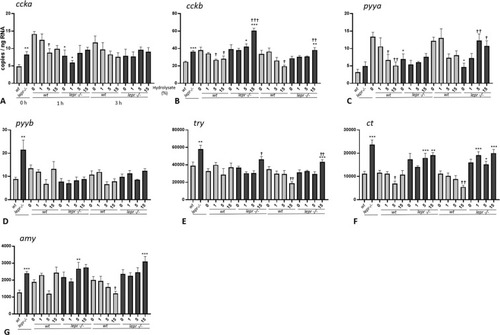
(A-G). Effect of lactalbumin hydrolysate administration on digestion and absorption related genes in larval trunk (8 dpf). Values are mean ± SE (n = 8). Differences in tube-feeding test with respect to the values on the 0% hydrolysate group (indicated by †) within each zebrafish line (lepr−/−or wt) were assessed by one-way ANOVA. Differences between the lines at each sampling time (indicated by *) were assessed by two-way ANOVA. Two-way ANOVA shows no significant effect of concentration [F (3, 48) = 1.085; p > 0.05] but significant effect of genotype [F (1, 48) = 12.07; p < 0.01] at 1 h and no significant effects of concentration [F (3, 48) = 0.3605; p > 0.05] and genotype [F (1, 48) = 0.5396; p > 0.05] at 3 h for ccka; significant effects of concentration [F (3, 53) = 3.643; p < 0.05] and genotype [F (1, 53) = 35.53; p < 0.0001] at 1 h and no significant effects of concentration [F (3, 54) = 1.226; p > 0.05] and genotype [F (1, 54) = 2.163; p > 0.05] at 3 h for cckb; significant effects of concentration [F (3, 55) = 3.122; p < 0.05] and genotype [F (1, 55) = 5.575; p < 0.05] at 1 h and no significant effects of concentration [F (3, 56) = 0.4206; p > 0.05] and genotype [F (1, 56) = 1.593; p > 0.05] at 3 for pyya; no significant effect of concentration [F (3, 56) = 1.655; p > 0.05] but a significant effect of genotype [F (1, 56) = 8.044; p < 0.01] at 1 h and significant effect of concentration [F (3, 54) = 4.045; p < 0.05] but not of genotype [F (1, 54) = 2.308; p > 0.05] at 3 h for pyyb; significant effect of concentration [F (3, 55) = 3.464; p < 0.05] but not of genotype [F (1, 55) = 0.2529; p > 0.05] at 1 h and no significant effect of concentration [F (3, 56) = 0.6295; p > 0.05] but significant effect of genotype [F (1, 56) = 9.654; p < 0.01] at 3 h for try; no significant effect of concentration [F (3, 55) = 1.443; p > 0.05] but significant effect of genotype [F (1, 55) = 43.10; p < 0.0001] at 1 h and no significant effect of concentration [F (3, 56) = 1.362; p > 0.05] but significant effect of genotype [F (1, 56) = 78.56; p < 0.0001] at 3 h for ct; significant effects of concentration [F (3, 55) = 4.853; p < 0.05] and genotype [F (1, 55) = 6.070; p < 0.05] at 1 h and no significant effect of concentration [F (3, 56) = 0.1714; p > 0.05], but significant effect of genotype [F (1, 56) = 23.34; p < 0.0001] at 3 h for amy. A Dunnett’s multiple comparison test for one-way ANOVA and a post-hoc Turkey’s multiple comparison were used to assess for specific pairwise differences (*, † = p < 0.05; **, †† = p < 0.01 and ***, ††† = p < 0.001). |