
- Title
-
Claudin h Is Essential for Hair Cell Morphogenesis and Auditory Function in Zebrafish
- Authors
- Gong, J., Qian, P., Hu, Y., Guo, C., Wei, G., Wang, C., Cai, C., Wang, H., Liu, D.
- Source
- Full text @ Front Cell Dev Biol
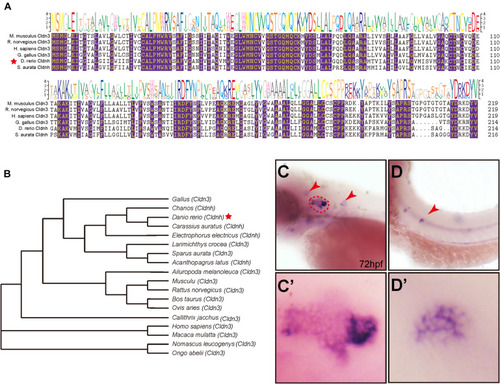
The phylogenetic and expression analysis of zebrafish EXPRESSION / LABELING:
|
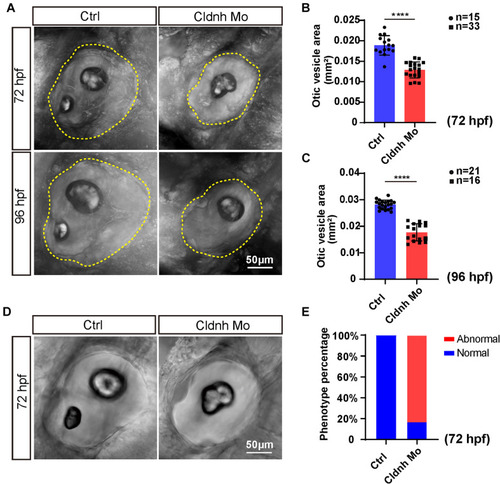
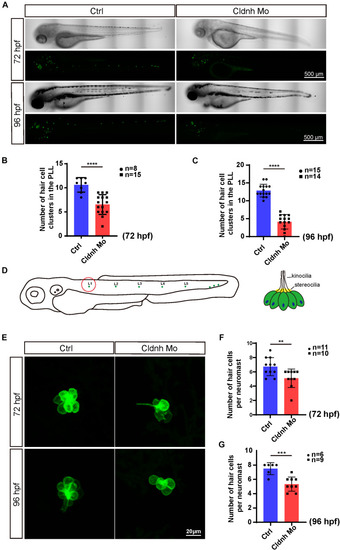
Loss function of PHENOTYPE:
|
Loss function of the PHENOTYPE:
|
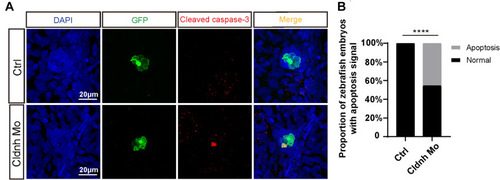
EXPRESSION / LABELING:
PHENOTYPE:
|
EXPRESSION / LABELING:
PHENOTYPE:
|
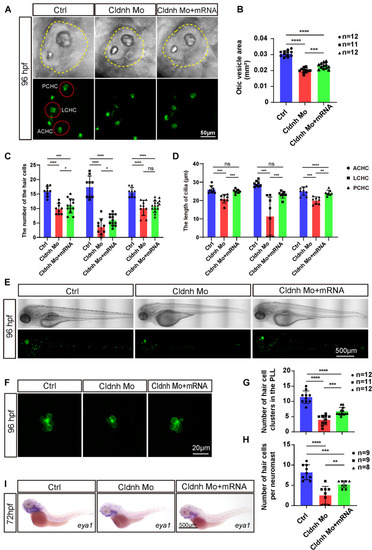
Overexpression of EXPRESSION / LABELING:
PHENOTYPE:
|
EXPRESSION / LABELING:
PHENOTYPE:
|
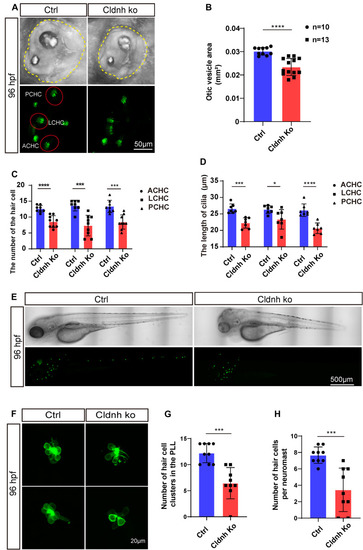
Knocking out of |