FIGURE SUMMARY
Title

Ccdc103 promotes myeloid cell proliferation and migration independent of motile cilia

Authors
Falkenberg, L.G., Beckman, S.A., Ravisankar, P., Dohn, T.E., Waxman, J.S.
Source
Full text @ Dis. Model. Mech.

ccdc103 is expressed in myeloid cells. (A,B) ccdc103 expression in a 17-somite stage (ss) wild-type (WT) embryo. hp, hematovascular progenitors (black arrowheads); pn, pronephros (yellow arrowhead). (C,D) The anterior domain of ccdc103 expression (black arrowheads) is expanded in embryos co-injected with scl and lmo2 mRNAs. In A, C and D, images are lateral views with anterior left. In B, image is a dorsal view. (E) RT-PCR for ccdc103, l-plastin (positive control) and gapdh performed on cDNA isolated from fluorescence-activated cell sorting (FACS)-sorted spi1b:EGFP+ zebrafish myeloid progenitor cells. (F) RT-qPCR for ccdc103 and gata1 performed on cDNA isolated from embryos injected with spi1b mRNA. *P<0.05 (two-tailed unpaired Student's t-test). (G) RT-PCR for human CCDC103 was performed with cDNA isolated from HL-60 cells, CD34+/CD38 hematopoietic stem cells (HSCs) and cord blood. (H-H″) Immunohistochemistry (IHC) for Ccdc103 (arrows), GFP and DAPI in an mpx:GFP+ zebrafish neutrophil at 24 hpf. Scale bars: 100 μm (A-D), 10 μm (H).

CCDC103 colocalizes with TUBA and DYNC1H1. (A-D) IHC for CCDC103, DYNC1H1 and TUBA in HL-60 cells. Yellow arrows indicate the microtubule-organizing center. (E-H) HL-60-derived neutrophil-like cells. (I-L) HL-60-derived macrophage-like cells. In E-L, yellow arrowheads indicate regions of colocalization of CCDC103 and TUBA in neutrophil-like and macrophage-like cells. Scale bars: 10 μm (A-E,F-I,J-L), 2 μm (A′,E′,I′).

smh mutant embryos have fewer primitive myeloid cells at 24 hpf. (A,B) Representative images of WT sibling (n=15) and smh embryos (n=5) carrying the spi1b:EGFP transgene at the 20-ss. Inset indicates the region of the embryo being imaged. A, anterior; D, dorsal; P, posterior; V, ventral. (C) Quantification of spi1b:EGFP+ myeloid progenitors from one yolk hemisphere of individual embryos. (D,E) Representative images of WT (n=10) and smh (n=10) embryos with mpx:GFP transgene at 24 hpf. (F) Quantification of mpx:GFP+ cells from one yolk hemisphere of individual embryos. (G,H) Representative images of WT sibling (n=19) and smh (n=9) embryos with mpeg1.1:YFP transgene at 24 hpf. (I) Quantification of mpeg1.1:YFP+ myeloid progenitors from one yolk hemisphere of individual embryos. For graphs in C, F and I, each data point represents an individual embryo. **P<0.005, *P<0.05 (two-tailed unpaired Student's t-test). Scale bars: 100 μm.

smh myeloid cells are less proliferative. (A,B) Representative images of WT (n=12) and smh (n=19) embryos with mpx:GFP transgene pulsed with EdU at the 20-ss and fixed at 24 hpf. White arrowheads indicate EdU+ cells. (C) Quantification of EdU+/mpx:GFP+ cells from one yolk hemisphere of individual embryos, each data point representing an individual embryo. (D,E) Representative images of WT (n=20) and smh (n=9) embryos with mpeg:YFP transgene pulsed with EdU at the 20-ss and fixed at 24 hpf. White arrowheads indicate EdU+ cells. (F) Quantification of EdU+/mpeg:YFP+ cells from one yolk hemisphere of individual embryos, each data point representing an individual embryo. For C and F, *P<0.05 (two-tailed unpaired Student's t-test). Scale bars: 100 μm.

smh mutant neutrophils display directed migration defects. (A) Schematic outlining the wound generated with the multiphoton laser. The dashed line box indicates the imaging area. (B,C) Representative confocal projection images of wounded WT (n=6) and smh (n=6) embryos with the mpx:GFP transgene at 24 hpf. (D) Quantification of migration efficiency scores calculated from point position data generated in Imaris. Each data point represents an individual cell from a minimum of three separate experiments, per genotype. (E) Quantification of the maximum track speed of migrating cells. (F,G) Maximum confocal projections of wounded WT and smh embryos bearing the mpx:GFP transgene with individual cells projected as 3D surfaces and color coded according to sphericity index, as calculated by Imaris. (H) Quantification of the mean cell sphericity index. Box and whisker plots represent individual cells from all independent experiments at each time point imaged, in order to capture changes in cell sphericity over the course of the time-lapse sequence. In E and H, the box and whisker plots represent the median value (center line), with the box including all values from the two median quartiles and the whiskers representing minimum and maximum values (with no outliers excluded). (I,J) Representative single z-slices from high-resolution live confocal imaging of individual mpx:GFP+ cells from WT (n=10) and smh (n=12) embryos. In I, the arrow indicates a uropod and the arrowhead indicates lamellipodia. In J, the arrow indicates cytoplasmic extension. (K) Mean circularity index for individually imaged cells as calculated in Imaris. **P<0.005, *P<0.05 (two-tailed unpaired Student's t-test). Scale bars: 100 μm (B,C,F,G), 10 μm (I,J).

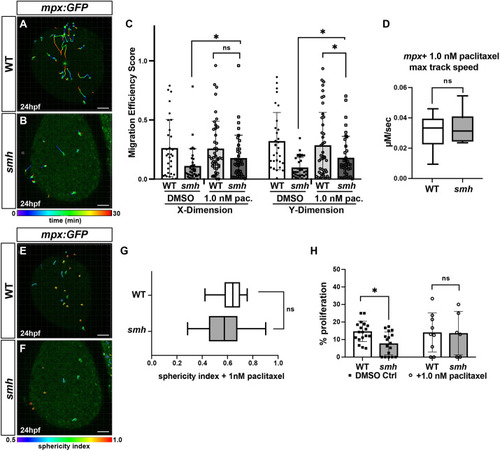
(A,B) Representative confocal projection images from wounding experiments of paclitaxel-treated WT (n=4) and smh (n=4) mpx:EGFP transgenic embryos at 24 hpf. (C) Quantification of migration efficiency scores calculated from point position data generated in Imaris. Each data point represents an individual cell from a minimum of three separate experiments, per genotype, per treatment. (D) Quantification of maximum track speed. Each data point represents an individual cell. Cell tracks and sphericity were generated by Imaris. (E,F) Maximum confocal projections of wounded, paclitaxel-treated WT and smh embryos bearing the mpx:GFP transgene with individual cells projected as 3D surfaces and color coded according to sphericity index as calculated by Imaris. Red, more spherical; blue, less spherical. (G) Mean cell sphericity indices as calculated in Imaris. In D and G, the box and whisker plots represent the median value (center line), with the box including all values from the two median quartiles and the whiskers representing minimum and maximum values (with no outliers excluded). (H) The percentage of EdU+/mpx:EGFP+ cells from transgenic WT and smh mutant embryos, pulsed with EdU at 17-ss and treated with paclitaxel from 17-ss to 24 hpf. *P<0.05; ns, not significant (two-tailed unpaired Student's t-test). Scale bars: 100 μm.

SPAG6 directly interacts with CCDC103. (A) Schematic of human SPAG6 and DYNC1H1 proteins. Specific domains identified by Y2H and portion of DYNC1H1 cloned into the LuTHy prey vector are indicated with brackets. The entirety of the SPAG6 CDS was included in the respective LuTHy prey vector. (B) BRET ratios for the interaction between CCDC103 and DYNC1H1 in the presence of DMSO, nocodazole and paclitaxel. (C) BRET ratios for the interaction between CCDC103 and SPAG6 in the presence of DMSO, nocodazole and paclitaxel. (D) Schematic of WT CCDC103 protein and three mutations found in PCD patient mutations. Relative severity of the patient PCD phenotype associated with the mutation indicated in parentheses. (E) BRET ratios for the interaction between DYNC1H1 and WT and mutant CCDC103 proteins. (F) BRET ratios for the interaction between SPAG6 and WT and mutant CCDC103 proteins. **P<0.005, *P<0.05; ns, not significant (two-tailed unpaired Student's t-test).

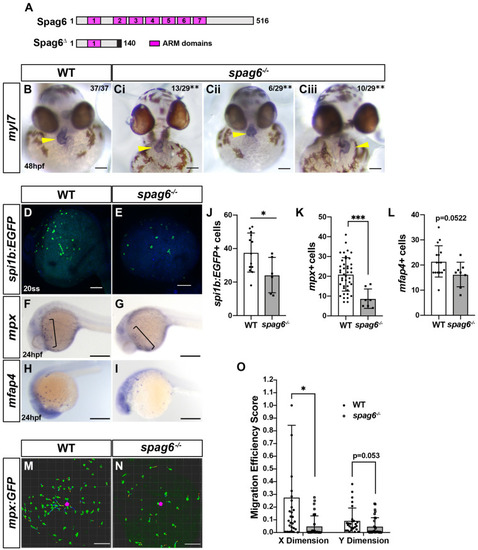
(A) Domain architecture for WT zebrafish Spag6 and the predicted truncation from the spag6 mutant allele used. (B,Ci-iii) ISH for myl7 in WT and spag6 mutant embryos at 48 hpf. (B,Ci) Normally (situs solitus, dextral) looped hearts in WT and spag6 mutant embryos. (Cii) Linearized heart in spag6 mutant. (Ciii) Reverse (situs inversus) heart in spag6 mutant. Yellow arrowheads indicate hearts. Fractions indicate the number of embryos with the given phenotype. **P<0.001 (Fisher's exact test). (D,E) Whole-mount IHC for spi1b:EGFP in WT (n=11) and spag6 mutants (n=8). (F,G) Whole-mount ISH for the neutrophil marker mpx in WT (n=45) and spag6 mutant (n=11) embryos at 24 hpf. (H,I) Whole-mount ISH for the macrophage marker mfap4 in WT (n=19) and spag6 mutant (n=8) embryos at 24 hpf. (J-L) Quantification of myeloid progenitors (spi1b:EGFP+), neutrophils (mpx+) and macrophages (mfap4+) from a single yolk hemisphere of the individual embryos. (M,N) Representative confocal projection images from wounding experiments of WT sibling (n=4) and spag6−/− (n=4) mpx:EGFP transgenic embryos at 24 hpf. (O) Migration efficiency scores from cell tracks of yolk wounding assays in WT and spag6 mutant mpx:EGFP+ embryos at 24 hpf. ***P<0.0001, *P<0.05 (two-tailed unpaired Student's t-test). Scale bars: 50 μm (B-Ciii), 300 μm (F-I), 100 μm (D,E,M,N).

ZFIN is incorporating published figure images and captions as part of an ongoing project. Figures from some publications have not yet been curated, or are not available for display because of copyright restrictions.

EXPRESSION / LABELING:
Genes:
Antibody:
Fish:
Anatomical Term:
Stage: 20-25 somites

ZFIN is incorporating published figure images and captions as part of an ongoing project. Figures from some publications have not yet been curated, or are not available for display because of copyright restrictions.

EXPRESSION / LABELING:
Gene:
Antibody:
Fish:
Anatomical Term:
Stage: 20-25 somites
PHENOTYPE:
Fish:
Observed In:
Stage: 20-25 somites

ZFIN is incorporating published figure images and captions as part of an ongoing project. Figures from some publications have not yet been curated, or are not available for display because of copyright restrictions.

PHENOTYPE:
Fish:
Observed In:
Stage: Prim-5
Acknowledgments
This image is the copyrighted work of the attributed author or publisher, and ZFIN has permission only to display this image to its users. Additional permissions should be obtained from the applicable author or publisher of the image. Full text @ Dis. Model. Mech.