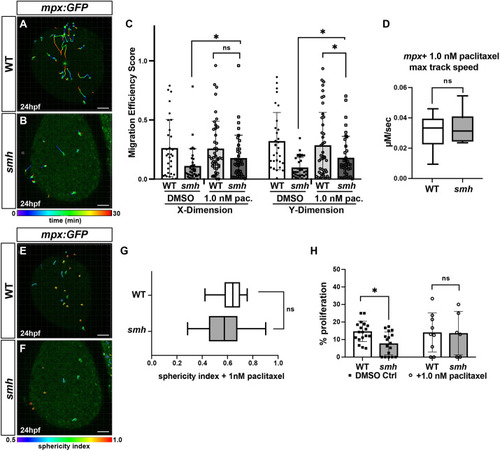
(A,B) Representative confocal projection images from wounding experiments of paclitaxel-treated WT (n=4) and smh (n=4) mpx:EGFP transgenic embryos at 24 hpf. (C) Quantification of migration efficiency scores calculated from point position data generated in Imaris. Each data point represents an individual cell from a minimum of three separate experiments, per genotype, per treatment. (D) Quantification of maximum track speed. Each data point represents an individual cell. Cell tracks and sphericity were generated by Imaris. (E,F) Maximum confocal projections of wounded, paclitaxel-treated WT and smh embryos bearing the mpx:GFP transgene with individual cells projected as 3D surfaces and color coded according to sphericity index as calculated by Imaris. Red, more spherical; blue, less spherical. (G) Mean cell sphericity indices as calculated in Imaris. In D and G, the box and whisker plots represent the median value (center line), with the box including all values from the two median quartiles and the whiskers representing minimum and maximum values (with no outliers excluded). (H) The percentage of EdU+/mpx:EGFP+ cells from transgenic WT and smh mutant embryos, pulsed with EdU at 17-ss and treated with paclitaxel from 17-ss to 24 hpf. *P<0.05; ns, not significant (two-tailed unpaired Student's t-test). Scale bars: 100 μm.
|
