
- Title
-
Notch regulates vascular collagen IV basement membrane through modulation of lysyl hydroxylase 3 trafficking
- Authors
- Gross, S.J., Webb, A.M., Peterlin, A.D., Durrant, J.R., Judson, R.J., Raza, Q., Kitajewski, J.K., Kushner, E.J.
- Source
- Full text @ Angiogenesis

Loss of Rab10 impairs endothelial basement membrane secretion. (a) Immunoblot of Rab10 in ECs transfected with either scrambled or Rab10 siRNA and probed for indicated proteins. (b) Representative images of scramble or Rab10 siRNA-treated ECs and stained for collagen IV (Col IV) (red), actin (green), and DNA (blue). Dotted green line indicates cell outline. Arrowheads denote extracellular Col IV secretion. (c) Graph of Col IV extracellular ratio in scramble or Rab10 siRNA-treated ECs. N number of cells. (d) Representative image of ECs expressing GFP only (control), GFP-Rab10 constitutively active (CA) or GFP-Rab10 dominant negative (DN), stained for Col IV (red) and DNA (blue). Dotted green line indicates cell outline. Arrowheads denote extracellular Col IV secretion. (e) Graph of Col IV extracellular ratio in ECs expressing GFP only (control) or GFP-Rab10 CA/DN. N number of cells. (f) Representative images of scramble or Rab10 siRNA-treated ECs and stained for laminin (red) perlecan (green), actin (grey), and DNA (blue). Dotted green line indicates cell outline. Arrowheads denote extracellular Col IV secretion. (g) Graph of extracellular basement membrane (BM) ratio in scramble or Rab10 siRNA-treated ECs between indicated secreted proteins. N number of cells. (h) Representative image of fibrin-bead sprouts between indicated siRNA treatment groups. Sprouts were stained for actin (grey) to delineate sprout morphology. (i–k) Graphs of sprouting parameters for scramble or Rab10 siRNA-treated sprouts. N number of measurements. (l) Representative images of ECs expressing GFP only (control) or GFP-Rab10 CA/DN in fibrin-bead sprouts. Dotted red line indicates line scan of (m). Arrowheads denote extracellular Col IV secretion. (m) Line scan measurement of Col IV fluorescence intensity shown in (l). (n–p) Graph of sprouting parameters for GFP only (control) or GFP-Rab10 CA/DN expressing sprouts. N number of measurements. For all experiments, data represented as mean ± 95% confidence intervals. Black bars indicate comparison groups with indicated p-values. All p-values are from two-tailed Student’s t-test from at least three experiments. *p ≤ 0.05; **p ≤ 0.01; ***p ≤ 0.001; ****p ≤ 0.0001; ns not significant |

Collagen IV follows a post-Golgi secretory pathway. (a) Representative images of ECs treated with brefeldin A (BFA) at indicated time points after BFA exposure. Cells were stained for collagen IV (Col IV) (red), actin (green), and DNA (blue). Arrowheads denote extracellular Col IV secretion. (b) Graph of Col IV extracellular ratio in control or BFA-treated ECs at indicated time points after BFA exposure. N number of cells. (c) Immunoblot of Col IV in ECs treated with cycloheximide (CHX) (20 mg/ml) and probed for indicated proteins. (d) Immunoblot of Col IV in ECs treated with both CHX + BFA and probed for indicated proteins. (e) Graph of Col IV protein accumulation in ECs treated with CHX, and both CHX + BFA. Col IV accumulations were normalized to α-tubulin levels. N number of replicates. (f) Immunoblot of Col IV in ECs transfected with either scramble or Rab10 siRNA and treated with CHX. EC lysate probed for indicated proteins. (g) Graph of Col IV levels in ECs transfected with either scramble or Rab10 siRNA and treated with CHX. Col IV accumulations were normalized to α-tubulin levels. N number of replicates. (h) Representative images of ECs cultured in VEGF-containing or serum-starve (SS) media and stained for Col IV (red), actin (green), and DNA (blue). Dotted green line indicates cell outline. Arrowheads denote extracellular Col IV secretion. (i) Graph of Col IV extracellular ratio of ECs cultured in VEGF-containing or SS media. N number of cells. (j) Immunoblot of Col IV in ECs cultured in VEGF-containing or SS media treated with CHX for the indicated time and probed for indicated proteins. (k) Immunoblot of Col IV in ECs cultured in VEGF-containing or SS media treated with CHX and chloroquine (CLQ) (10 µM) for the indicated times and probed for indicated proteins. (l) Immunoblot of Col IV in ECs transfected with either scramble or Rab10 siRNA and cultured in VEGF-containing or SS media treated with CHX and/or BFA for 8hrs and probed for indicated proteins. (m) Immunoblot of Col IV in Human umbilical vein ECs (HUVEC), Human aortic ECs (HAEC), Human brain microvascular ECs (HBMEC) and Human dermal ECs (HDEC) cultured in either VEGF-containing or SS media and probed for indicated proteins. For all experiments, data represented as mean ± 95% confidence intervals. Black bars indicate comparison groups with indicated p-values. All p-values are from two-tailed Student’s t-test from at least three experiments. *p ≤ 0.05; **p ≤ 0.01; ***p ≤ 0.001; ****p ≤ 0.0001; ns not significant |
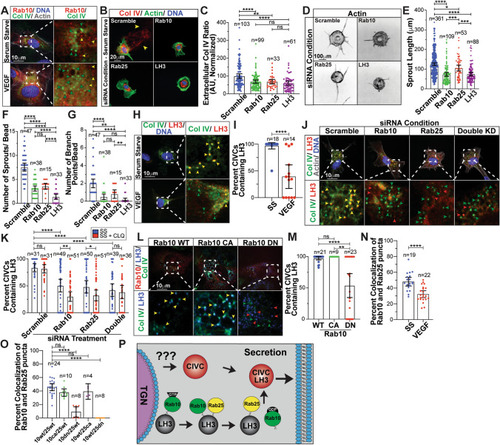
Rab10 and Rab25 work in combination to traffic LH3 to CIVC vesicles. (a) Representative images of ECs expressing RFP-Rab10 wild-type (WT) and stained for collagen IV (Col IV) (green). Green arrowheads indicate collagen IV-containing (CIVC) vesicles only and yellow arrowheads indicate Rab10 puncta only. (b) Representative images of scramble, Rab10, Rab25, or LH3 siRNA-treated ECs and stained for Col IV (red), actin (green), and DNA (blue). Arrowheads denote extracellular Col IV secretion. (c) Graph of extracellular Col IV ratio of scramble, Rab10, Rab25, or LH3 siRNA-treated ECs cultured in serum-starve (SS) media. (d) Representative images of fibrin-bead sprouts between indicated siRNA treatment groups. Sprouts were stained for actin (grey) to delineate sprout morphology. (e–g) Graphs of sprouting parameters for scramble, Rab10, Rab25, or LH3 siRNA-treated sprouts. (h) Representative images of ECs cultured in VEGF-containing or SS media and stained for Col IV (green), LH3 (red), and DNA (blue). Green arrowheads indicate CIVC vesicles only and yellow arrowheads indicate co-localized puncta. (i) Graph of percent CIVC vesicles co-localized with LH3 in ECs cultured in VEGF-containing or SS media. (j) Representative images of scramble, Rab10, Rab25, or both Rab10/25 siRNA-treated ECs and stained for Col IV (green), LH3 (red), actin (grey), and DNA (blue). Yellow arrowheads indicate co-localized puncta only, green arrowheads indicate Col IV only puncta, and red arrowheads indicate LH3 puncta only. (k) Graph of percent CIVC vesicles co-localized with LH3 in scramble, Rab10, Rab25, or LH3 siRNA-treated conditions cultured in SS media or SS media with CLQ (10 µM). (l) Representative images of ECs expressing RFP-Rab10 WT, RFP-Rab10 constitutively active (CA), or RFP-Rab10 dominant negative (DN), stained for Col IV (green) and LH3 (blue). Yellow arrowheads indicate co-localized puncta only, green arrowheads indicate Col IV puncta, and red arrowheads indicate LH3 puncta. (m) Graph of percent CIVC vesicles co-localized with LH3 in ECs expressing RFP-Rab10 WT/CA/DN. (n) Graph of percent Rab10 wild-type (WT) puncta co-localized with Rab25 in either VEGF-containing or SS media. (o) Graph of percent Rab10 puncta co-localized with Rab25 in ECs transfected with indicated constructs. (p) Schematic diagram showing how Rab10 and Rab25 function to coordinate delivery of LH3 to CIVC vesicles for proper secretion of Col IV. For all graphs n number of cells unless otherwise indicated. For all experiments, data represented as mean ± 95% confidence intervals. Black bars indicate comparison groups with indicated p-values. All p-values are from two-tailed Student’s t-test from at least three experiments. *p ≤ 0.05; **p ≤ 0.01; ***p ≤ 0.001; ****p ≤ 0.0001; ns not significant |
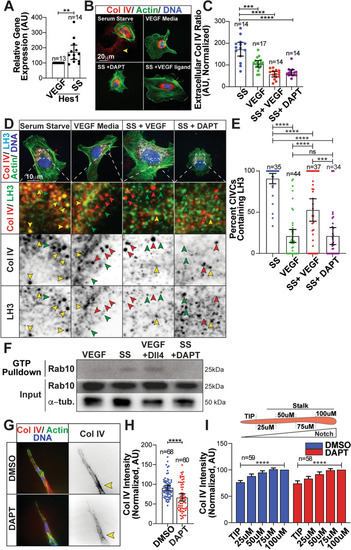
Notch signaling regulates LH3 trafficking. (a) Graph of relative hes1 gene expression in ECs cultured in VEGF-containing or serum-starve (SS) media. Gene expression levels normalized to GAPDH. N number of replicates. (b) Representative images of ECs cultured in VEGF-containing, SS media, SS media + VEGF ligand (100 ng/µL), or SS media + DAPT (10 µmol/L) and stained for Collagen IV (Col IV) (red), actin (green), and DNA (blue). Arrowhead denotes extracellular Col IV secretion. (c) Graph of Col IV extracellular ratio of ECs across indicated groups. (d) Representative images of ECs cultured in indicated groups and stained for Col IV (red), LH3 (light blue), actin (green), and DNA (blue). Yellow arrowheads indicate co-localized puncta only, red arrowheads indicate Col IV only puncta, and green arrowheads indicate LH3 puncta only. (e) Graph of percent CIVC vesicles co-localized with LH3 in indicated conditions. (f) Immunoprecipitation blot for active (GTP-bound) Rab10 in the presence of VEGF-supplemented or SS media, VEGF media on a Dll4-coated plate, and SS media containing DAPT. (g) Representative image of fibrin-bead sprout stained for Col IV (red), actin (green) and DNA (blue). Arrowheads denote Col IV accumulation. (h) Graph of Col IV intensity between indicated groups. N number of sprouts. (i) Top- schematic of Col IV measurements taken on sprouts. Graph of Col IV intensity starting at the vascular front and measured back every 50 µm between indicated groups. Intensities are normalized to Col IV levels at 100 μm for each group. For all graphs n number of cells unless otherwise indicated. For all experiments, data represented as mean ± 95% confidence intervals. Black bars indicate comparison groups with indicated p-values. All p-values are from two-tailed Student’s t-test from at least three experiments. *p ≤ 0.05; **p ≤ 0.01; ***p ≤ 0.001; ****p ≤ 0.0001; ns not significant |
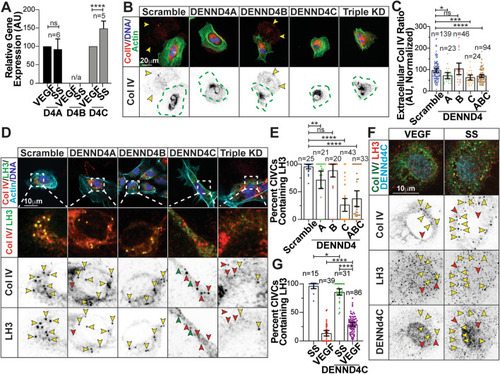
Notch signaling regulates Rab10 GTPase activity though DENNd4C. (a) Graph of relative gene expression of DENNd4A,B,C in ECs cultured in VEGF-containing or serum-starve (SS) media. Gene expression levels normalized to GAPDH. N number of replicates. (b) Representative images of indicated siRNA-treated ECs stained for collagen IV (Col IV) (red), actin (green), and DNA (blue). Dotted green lines indicates cell outline. Arrowheads denote extracellular Col IV secretion. (c) Graph of collagen IV (Col IV) extracellular ratio in indicated siRNA-treated ECs. (d) Representative images of indicated siRNA-treated ECs stained for Col IV (red), LH3 (green), actin (light blue), and DNA (blue). Yellow arrowheads indicate co-localized puncta only, red arrowheads indicate Col IV only puncta, and green arrowheads indicate LH3 puncta only. (e) Graph of percent CIVCs containing LH3 in indicated siRNA-treated ECs. (f) Representative images of ECs expressing DENNd4C-flag and stained for Col IV (green) and LH3 (red). Yellow arrowheads indicate Col IV-containing vesicles co-localized with LH3 and red arrowheads indicate LH3 co-localized with DENNd4C-flag. (g) Graph of percent Col IV-containing vesicles with LH3 in ECs expressing DENNd4C-flag in indicated culture media. For all graphs n number of cells unless otherwise indicated. Black bars indicate comparison groups with indicated p-values. All p-values are from two-tailed Student’s t-test from at least three experiments. *p ≤ 0.05; **p ≤ 0.01; ***p ≤ 0.001; ****p ≤ 0.0001; ns not significant |
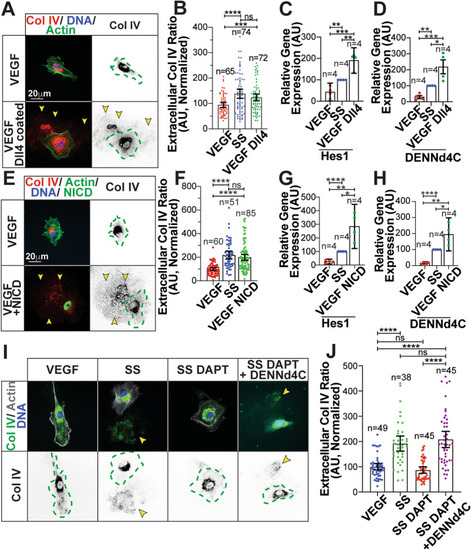
Dll4 and Notch-intracellular domain alters collagen IV secretion and gene expression. (a) Representative images of ECs plated on coverslips coated with recombinant protein delta like ligand 4 (Dll4) (1ug/ml). (b) Graph of collagen IV (Col IV) extracellular ratio in ECs plated on Dll4 coated coverslips compared to culture media controls. N number of cells. (c) Graph of relative Hes1 gene expression in ECs cultured in VEGF-containing, serum-starve (SS) media or plated on Dll4 ligand. N number of replicates. (d) Graph of relative DENNd4C gene expression in ECs cultured in either VEGF-containing, SS media or plated on Dll4. N number of replicates. (e) Representative images of ECs expressing Notch1 intracellular domain (NICD) cultured in VEGF-containing media. N number of replicates. (f) Graph of Col IV extracellular ratio in ECs between indicated groups. N number of cells. (g) Graph of relative Hes1 gene expression in ECs between indicated groups. N number of replicates. (h) Graph of relative DENNd4C gene expression in ECs between indicated groups. N number of replicates. (i) Representative images of ECs stained for Col IV (green), actin (grey), DNA (blue) and flag (light blue) cultured with VEGF, in SS media, in SS media with DAPT, or in SS media with DAPT overexpressing DENNd4C-flag. (j) Graph of Col IV extracellular ratio in indicated groups. N number of cells. For all experiments, data represented as mean ± 95% confidence intervals. Black bars indicate comparison groups with indicated p-values. All p-values are from two-tailed Student’s t-test from duplicate experiments. *p ≤ 0.05; **p ≤ 0.01; ***p ≤ 0.001; ****p ≤ 0.0001; ns not significant |
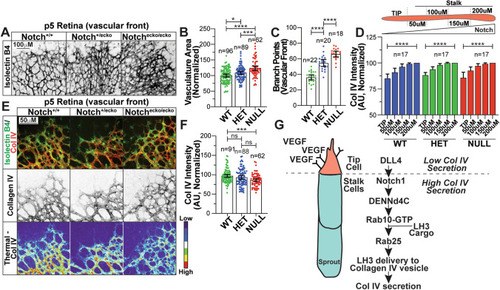
Notch1 deficient mouse retinas have reduced collagen IV. (a) Representative images of wild-type (WT; Cdh5-PAC-CreER+/−; Notch+/+), Notch EC knockout(ecko)/− (HET, Cdh5-PAC-CreER+/−; Notchflox/+), or Notchecko/ecko (NULL, Cdh5-PAC-CreER+/−; Notchflox/flox) retinas harvested at P5 and stained for isolectin B4 (IB4). (b) Graph of vasculature area for vessels between indicate genotypes. (c) Graph of number of branch points at vascular front. (d) Top- schematic of Col IV measurements taken on sprouts. Graph of collagen IV (Col IV) intensity starting at the vascular front and measured back every 50 μm between indicated groups. Intensities are normalized to Col IV levels at 200 μm for each group. (e) Representative images of retinas harvested at P5 and stained for Col IV (red), DNA (blue), and IB4 (green) to identify blood vessels between indicated genotypes. (f) Graph of Col IV fluorescence intensity across indicated groups. (g) Model- VEGF-binding at the tip cells decreases Notch activation. In stalk cells, Notch activation promotes expression of DENNd4c which activates Rab10. Active Rab10 works with Rab25 to traffic Lysyl hydroxylase 3 (LH3) to Col IV-containing vesicles, allowing for secretion of Col IV into the extracellular space. For all experiments, data represented as mean ± 95% confidence intervals. N number of measurements. In all conditions, 6 or more mice were used per group. Black bars indicate comparison groups with indicated p-values. All p-values are from two-tailed Student’s t-test from duplicate experiments. *p ≤ 0.05; **p ≤ 0.01; ***p ≤ 0.001; ****p ≤ 0.0001; ns, not significant |

ZFIN is incorporating published figure images and captions as part of an ongoing project. Figures from some publications have not yet been curated, or are not available for display because of copyright restrictions. EXPRESSION / LABELING:
|