
- Title
-
Progressively De-Differentiated Pancreatic Cancer Cells Shift from Glycolysis to Oxidative Metabolism and Gain a Quiescent Stem State
- Authors
- Ambrosini, G., Dalla Pozza, E., Fanelli, G., Di Carlo, C., Vettori, A., Cannino, G., Cavallini, C., Carmona-Carmona, C.A., Brandi, J., Rinalducci, S., Scupoli, M.T., Rasola, A., Cecconi, D., Palmieri, M., Dando, I.
- Source
- Full text @ Cells

Panc1 cells cultured in the stem-specific medium for 2, 4, and 8 weeks enhance their epithelial-to-mesenchymal transition (EMT)/stem properties. (A) Bright field representative images of Panc1 parental cells (P) and Panc1 cancer stem cells (CSCs) cultured in the stem-specific medium for 2, 4, and 8 weeks. Scale bar: 100 μm. (B) qPCR analysis of the basal expression of EMT markers, i.e., CDH1 and ZEB1, and stem markers, i.e., SOX2, NANOG, and OCT3/4, in Panc1 P cells and CSCs. The values are reported as fold change relative to P cells. (C) Cell viability analysis of Panc1 P cells and CSCs treated with 100 μM Oxaliplatin or 50 μM Gemcitabine (GEM) or 20 μM Sorafenib for 48 h. (D) Clonogenic assay: The percentage of wells in 96 well-plates with more than 3 cells is reported after 15 days of the seeding of 1 cell/well of Panc1 P cells or CSCs. (E) Soft agar colony formation assay: The number of Panc1 P or CSC colonies with diameter ≥ 25 μm grown in soft agar is reported after 21 days of 5 × 10⁴ cells seeded in each well. Histograms legends: white: P cells; light gray: CSCs 2 weeks; dark grey: CSCs 4 weeks; black: CSCs 8 weeks. (F) Panc1 parental cells and CSCs were stained with Vybrant Cell Labeling Solution (red) and injected into the yolk of zebrafish larvae at 2 dpf. The percentage of larvae with metastasis-forming cells was counted at 4 days post injection (dpi) in each experimental condition and reported in the histograms. Histograms legends: No mets.= larvae with no tumor cells outside the yolk; n mets < 5 = larvae with <5 tumor cells outside the yolk; n mets > 5 = larvae with >5 tumor cells outside the yolk. Histograms legends: white: P cells; light gray: CSCs 2 weeks; dark grey: CSCs 4 weeks; black: CSCs 8 weeks. Values are the means (± SE) of at least three independent biological replicates for in vitro assays and two biological replicates for in vivo assay. Statistical legend: p < 0.05 (*), p < 0.01 (**), or p < 0.001 (***) P cells versus CSCs; (§) CSCs 2 weeks versus CSCs 4 weeks; ($) CSCs 2 weeks versus CSCs 8 weeks; (#) CSCs 4 weeks versus CSCs 8 weeks. |

Long-term culture of cancer stem cells (CSCs) favors the entrance in a quiescent state. (A) Proliferation rate of Panc1 P and CSCs cultured in their specific-medium for 2, 4, 7, and 10 days. 5 × 10³ cells/well have been plated for each condition at time 0. Legend: White squared: P cells; gray rhombus: CSCs 2 weeks; black triangle: CSCs 4 weeks; star: CSCs 8 weeks. (B) Representative histograms of cell cycle analysis for each condition. (C) Cell cycle distribution of Panc1 P cells and CSCs through flow cytometry. (D) qPCR analysis of the quiescent markers MAD2L1, Cyclin B1, and RPLP0 in Panc1 P cells and CSCs. The values are reported as fold change relative to P cells. Histograms legends: white: P cells; light gray: CSCs 2 weeks; dark grey: CSCs 4 weeks; black: CSCs 8 weeks. Values are the means (± SE) of at least three independent biological replicates. Statistical legend: p < 0.05 (*) P cells versus CSCs; ($) CSCs 2 weeks versus CSCs 8 weeks; (#) CSCs 4 weeks versus CSCs 8 weeks. |

CSCs cultured in the differentiated-cell medium re-acquire epithelial features and exit from the quiescent state. (A) Bright field images of adherent cells derived from Panc1 CSCs after 24 h of culture in the differentiated-cell medium (DM). Scale bar: 100 μm. Proliferation rate of Panc1 P and adherent cells derived from Panc1 CSCs after 10 days (B) and 2 months (C) of culture in DM. 5 × 10³ cells/well have been plated for each condition at time 0. Legend: White squared: P cells; gray rhombus: adherent cells derived from CSCs 2 weeks; black triangle: adherent cells derived from CSCs 4 weeks; star: adherent cells derived from CSCs 8 weeks. Statistical legend: p < 0.05 (a) P cells versus AdCSCs 2 weeks; (b) P cells versus AdCSCs 4 weeks; (c) P cells versus AdCSCs 8 weeks; (d) AdCSCs 2 weeks versus AdCSCs 4 weeks; (e) AdCSCs 2 weeks versus AdCSCs 8 weeks; (f) AdCSCs 4 weeks versus AdCSCs 8 weeks. (D) qPCR analysis of the basal expression of EMT markers, i.e., CDH1 and ZEB1, and stem markers, i.e., SOX2, NANOG, and OCT3/4, in Panc1 P cells and adherent cells derived from Panc1 CSCs after 10 days and 2 months of culture in DM. The values are reported as fold change relative to P cells. (E) qPCR analysis of the quiescent markers MAD2L1 and Cyclin B1 in Panc1 P cells and adherent cells derived from Panc1 CSCs after 10 days and 2 months of culture in DM. The values are reported as fold change relative to P cells. Legend: parental cells: AdCSCs: adherent cells derived from the indicated CSCs cultured in DM for 10 days or more than 2 months. Values are the means (± SE) of at least three independent biological replicates. Statistical legend: p < 0.05 (*) P cells versus AdCSCs; (#) AdCSCs 4 weeks versus AdCSCs 8 weeks; (&) AdCSCs cultured in DM for 10 days versus the same cells cultured in DM for more than 2 months. |

Progressively CSC de-differentiation is accompanied by metabolic changes. Metabolomic quantification of intracellular levels of metabolites reported as fold change relative to parental cells. Metabolites from glycolysis (A), pentose phosphate pathway (B), and tricarboxylic acid cycle (C) in Panc1 P cells and CSCs cultured for 2, 4, and 8 weeks. Legend: white: parental (P) cells; light gray: CSCs 2 weeks; dark grey: CSCs 4 weeks; black: CSCs 8 weeks. Values are the means (± SE) of three technical replicates and three independent biological replicates. Statistical legend: p <0.05 (*) P cells versus CSCs; (§) CSCs 2 weeks versus CSCs 4 weeks; ($) CSCs 2 weeks versus CSCs 8 weeks; (#) CSCs 4 weeks versus CSCs 8 weeks. |
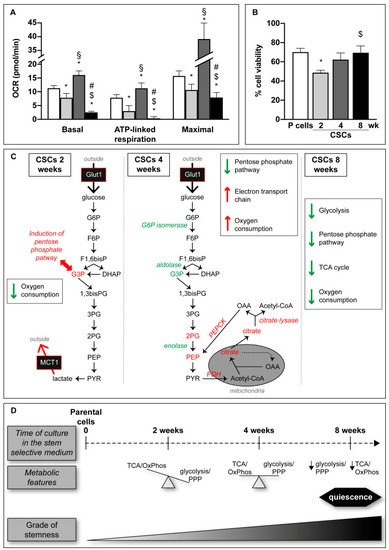
Metabolic features of CSCs. (A) Seahorse analysis of Panc1 P and CSCs cultured in their specific-medium; 6 × 10⁴ cells/well and 1 × 10⁵ cells/well of P and CSCs respectively have been plated for each condition. After 24 h, cells were treated with FCCP (400 nM), oligomycin (1 µg), and a mix of antimycin and rotenone (both 1 µM) and then analyzed. Histograms legends: white: parental (P) cells; light gray: CSCs 2 weeks; dark grey: CSCs 4 weeks; black: CSCs 8 weeks. (B) Cell viability analysis of Panc1 P cells and CSCs treated with 50 nM AZD3965, the MCT-1 inhibitor, for 72 h. Molecular (C) and schematic (D) representations of the data presented in this paper showing the metabolic plasticity of CSCs. In green are indicated the metabolites or metabolic enzymes whose intracellular level or expression, respectively, is decreased. Instead, are reported in red when their level is increased. In italic are reported the enzyme’s name. Values are the means (± SE) of three independent biological replicates. Statistical legend: p <0.05 (*) P cells versus CSCs; (§) CSCs 2 weeks versus CSCs 4 weeks; ($) CSCs 2 weeks versus CSCs 8 weeks; (#) CSCs 4 weeks versus CSCs 8 weeks. Legends: glucose transporter (Glut1); glucose-6-phosphate (G6P); fructose-6-phosphate (F6P); fosfofructokinase (PFK); fructose 1,6-bisphosphate (F1,6bisP); glyceraldehyde-3-phosphate (G3P); dihydroxyacetone phosphate (DAHP); 1,3-bisphospho glycerate (1,3bisPG); 3-phosphoglycerate (3PG); 2-phosphoglycerate (2PG); phosphoenolpyruvate (PEP); pyruvate (PYR); monocarboxylate transporter-1 (MCT1); pyruvate dehydrogenase (PDH); oxaloacetate (OAA); phosphoenolpyruvate carboxykinase (PEPCK); tricarboxylic acid (TCA) cycle; oxidative phosphorylation (OxPhos); pentose phosphate pathway (PPP). |

Metabolic features of adherent cells derived by CSCs. Metabolomic quantification of intracellular levels of metabolites reported as fold change relative to parental cells. Metabolites from glycolysis ( |