IMAGE

Figure 6

ID
ZDB-IMAGE-210414-70
Source
Figures for Ambrosini et al., 2020
Image
Figure Caption

Figure 6

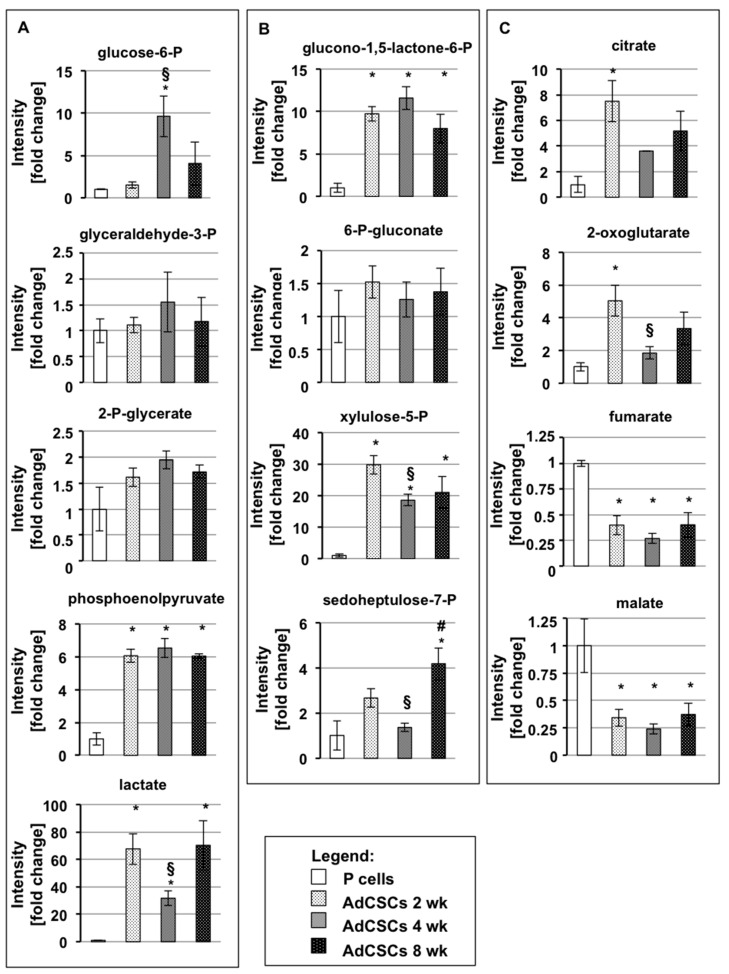
Metabolic features of adherent cells derived by CSCs. Metabolomic quantification of intracellular levels of metabolites reported as fold change relative to parental cells. Metabolites from glycolysis (A), pentose phosphate pathway (B), and tricarboxylic acid cycle (C) in Panc1 P cells and adherent cells derived from Panc1 CSCs after 2 months of culture in DM. Legend: P cells: parental cells; AdCSCs: adherent cells derived from the indicated CSCs cultured in DM for more than 2 months. Values are the means (± SE) of three technical replicates and two independent biological replicates. Statistical legend: p < 0.05 (*) P cells versus AdCSCs; (§) AdCSCs 2 weeks versus AdCSCs 4 weeks; (#) AdCSCs 4 weeks versus AdCSCs 8 weeks.

Acknowledgments
This image is the copyrighted work of the attributed author or publisher, and ZFIN has permission only to display this image to its users. Additional permissions should be obtained from the applicable author or publisher of the image. Full text @ Cells