
- Title
-
The ecotoxicological contaminant tris(4-chlorophenyl)methanol (TCPMOH) impacts embryonic development in zebrafish (Danio rerio)
- Authors
- Navarrete, J., Wilson, P., Allsing, N., Gordon, C., Margolis, R., Schwartz, A.V., Cho, C., Rogowski, B., Topps, J., George, U.Z., Sant, K.E.
- Source
- Full text @ Aquat. Toxicol.

Survival (%) of zebrafish embryos exposed to 0 (DMSO), 0.1, 0.5, 1, or 5 µM TCPMOH daily until 7 dpf. Total survival decreases temporally and in a concentration-dependent manner throughout the 7 day period (p<0.05). Fisher's exact tests were used to assess differences in frequencies between groups. Asterisks (*) indicate statistically significant changes from controls (p<0.05). n = 20–38 embryos per exposure group. |

Total anterior-posterior fish length in embryos exposed to 0.01% DMSO, 0.1, 0.5, 1, or 5 µM TCPMOH. Embryos exposed to 5 µM TCPMOH displayed stunted growth compared to controls (p<0.05). No other statistically significant trends were observed (p>0.05). ANOVA with Tukey post-hoc tests were used. Asterisks (*) indicate statistically significant changes from controls (p<0.05). n = 20–38 embryos per exposure group. |
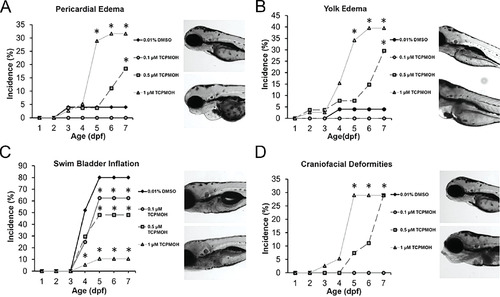
TCPMOH exposures increase the incidence of embryonic defects and decrease swim bladder inflation. Embryos were individually examined microscopically, daily from 1 to 7 dpf. The most common deformities presented were pericardial edema (A) and yolk edema (impaired yolk utilization) (B) manifesting as an inflated pericardial sac due to fluid retention and inflated, malformed yolk sac, respectively. Decreased (C) swim bladder inflation occurred in a concentration-dependent trend. Increased incidence of craniofacial malformations (D), presenting mostly as lower jaw deformities, were increased in the 1 µM exposure group. Fisher's exact tests were used to assess differences in frequencies between groups. Asterisks (*) indicate statistically significant changes from controls (p<0.05). n = 20–38 embryos per exposure group.v |
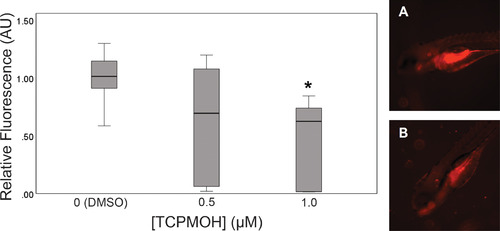
Embryos were exposed to 0, 0.5, or 1 µM TCPMOH once at 24 hpf in the presence of 0.25 mg/mL 7-ethoxyresorufin (7-ER) in DMSO. At 96 hpf, embryos were screened for EROD activity, as quantified by red fluorescent protein (RFP) intensity. Boxplots represent the median (quartile) relative RFP intensity to the background intensity and control (DMSO) group. Boxes represent true quartiles (25th, 50th, 75th percentile). Kruskal-Wallis test with Games-Howell post-hoc tests were used for nonparametric data. Images are shown for (A) DMSO and (B) 0.5 µM TCPMOH exposed fish. Asterisks (*) indicate statistically significant changes from controls (p<0.05). n = 9–11 embryos per exposure group. |
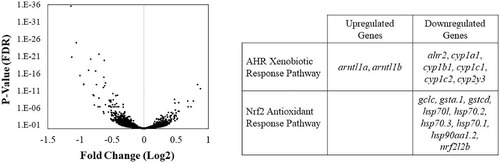
Overall distribution and altered expression of transcripts within the AHR Xenobiotic Response and Nrf2 Antioxidant Response pathways. Log2 fold change values and p-values (FDR) were graphed as a volcano plot, showing that the majority of significantly impacted genes were downregulated. Within the AHR and Nrf2 pathways, transcription factors ahr2 and nfe2l2b were both decreased, as were their enzymatic targets. FDR<0.05. |
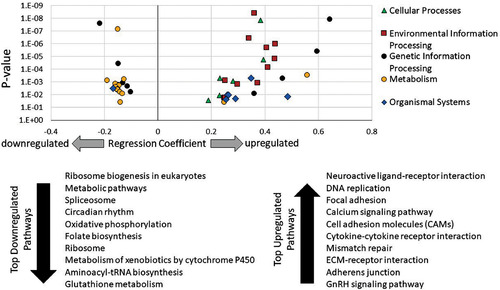
KEGG Pathways most significantly changed due to acute TCPMOH exposure during development. The ten most significantly up- and downregulated pathways are shown. The KEGG pathway hierarchies were used to group pathways by overarching processes, including cellular processes, environmental information processing, genetic information processing, metabolism, and organismal systems. Regression coefficients and p-values were plotted, with coefficients >0 indicating upregulated pathways and coefficients <0 indicating downregulated pathways. n = 5 samples per treatment group, each containing 8–10 embryos. |