
|
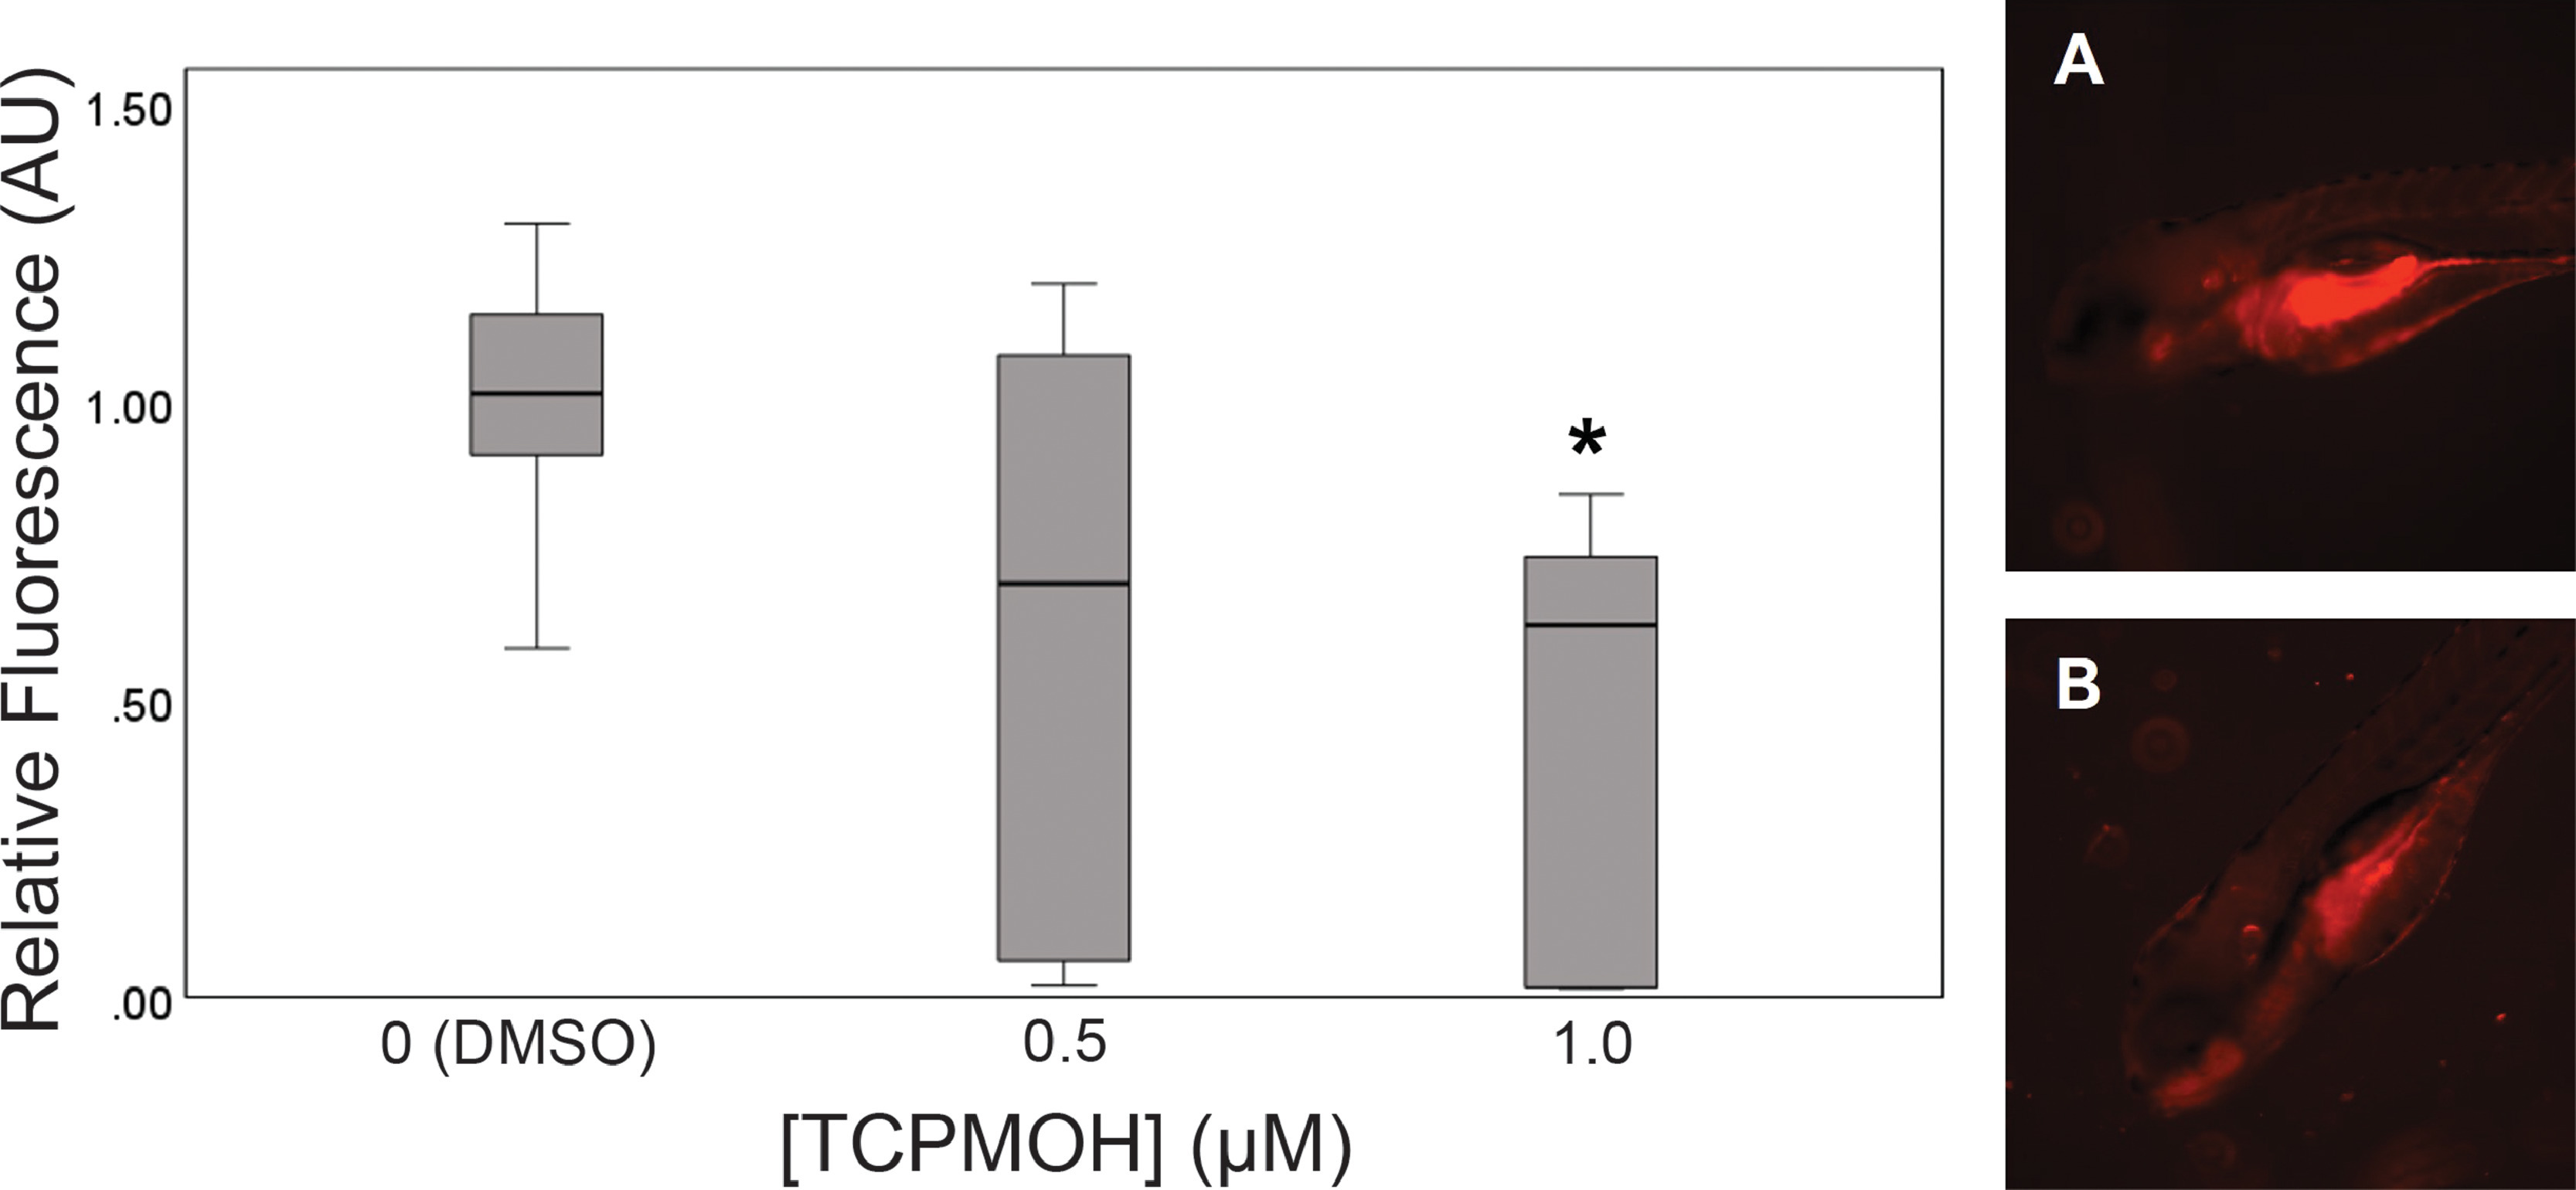
Fig. 4 Embryos were exposed to 0, 0.5, or 1 µM TCPMOH once at 24 hpf in the presence of 0.25 mg/mL 7-ethoxyresorufin (7-ER) in DMSO. At 96 hpf, embryos were screened for EROD activity, as quantified by red fluorescent protein (RFP) intensity. Boxplots represent the median (quartile) relative RFP intensity to the background intensity and control (DMSO) group. Boxes represent true quartiles (25th, 50th, 75th percentile). Kruskal-Wallis test with Games-Howell post-hoc tests were used for nonparametric data. Images are shown for (A) DMSO and (B) 0.5 µM TCPMOH exposed fish. Asterisks (*) indicate statistically significant changes from controls (p<0.05). n = 9–11 embryos per exposure group.