- Title
-
Single-cell mRNA profiling reveals changes in solute carrier expression and suggests a metabolic switch during zebrafish pronephros development
- Authors
- Schoels, M., Zhuang, M., Fahrner, A., Kuechlin, S., Sagar, S., Franz, H., Schmitt, A., Walz, G., Yakulov, T.A.
- Source
- Full text @ Am. J. Physiol. Renal Physiol.
|
Single-cell RNA sequence analysis of the developing zebrafish pronephros. A: t-distributed stochastic neighbor embedding (t-SNE) representation based on transcriptome similarities of 591 cells isolated from the zebrafish pronephros at 1 day postfertilization (dpf). Compared with later stages of development, cells did not group in distinct clusters. At 2 dpf, interrenal cells, the adrenocortical equivalent in zebrafish, formed a distinct cluster. B: t-SNE representation based on transcriptome similarities of 918 cells isolated from the zebrafish pronephros at 2 dpf. At this developmental stage, the isolated cells segregated into distinct clusters. C: t-SNE representation based on transcriptome similarities of 556 cells isolated from the zebrafish pronephros at 3 dpf. Although the corpuscles of Stannius and the proximal segments (podocytes and proximal convoluted and straight tubules) remained in distinct clusters, the distal segments overlapped at 3 dpf. |
|
Expression of solute carriers (SLCs) in the proximal convoluted and straight tubule of the developing zebrafish pronephros. A: ten most abundant SLCs in the proximal convoluted tubule at 1 day postfertilization (dpf) (PC1; outlined with blue) compared with the relative expression of these top 10 SLCs in the proximal straight tubule (PS1), distal early tubule (DE1), distal late tubule (DL1), and pronephric duct (PD1) as well as their expression at 2 dpf (PC2, PS2, DE2, DL2, and PD2, respectively) and 3 dpf (PC3, PS3, DE3, DL3, and PD3, respectively). B: 10 most abundant SLCs in PC3 (outlined with red) compared with the relative expression of these top 10 SLCs in PS3, DE3, DL3, and PD3 as well as their expression at 1 dpf and 2 dpf. C: relative change in expression between 1 dpf and 3 dpf for the top 10 candidates identified in the proximal convoluted tubule at 1 dpf and 3 dpf. Blue labeled bars indicate ≥60% abundance at 1 dpf; red labeled bars indicate ≥60% abundance at 3 dpf. The light blue and red bars correspond to <60% abundance. D: 10 most abundant SLCs in PS1 (outlined with blue) compared with the relative expression of these top 10 SLCs in PC1, DE1, DL1, and PD1 as well as their expression at 2 dpf and 3 dpf. E: 10 most abundant SLCs in PS3 (outlined with red) compared with the relative expression of these top 10 SLCs in PC3, DE3, DL3, and PD3 as well as their expression at 1 dpf and 2 dpf. F: relative change in expression between 1 dpf and 3 dpf for the top 10 candidates identified in the proximal straight tubule at 1 dpf and 3 dpf. Blue labeled bars indicate ≥60% abundance at 1 dpf; red labeled bars indicate ≥60% abundance at 3 dpf. The light blue and red bars correspond to <60% abundance. PC3; pronephric cells. |
|
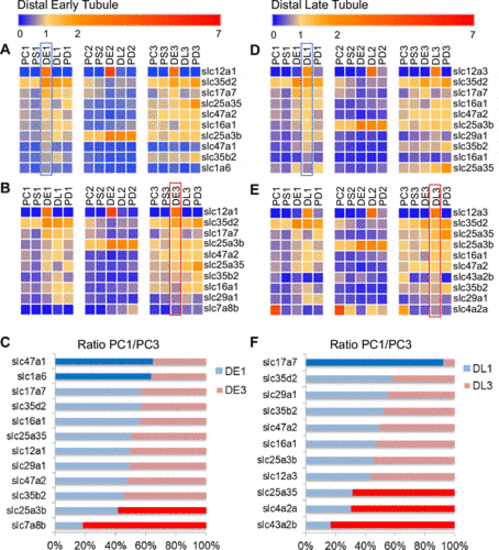
Expression of solute carriers (SLCs) in the distal early and late tubule of the developing zebrafish pronephros. A: ten most abundant SLCs in the distal early tubule at 1 day postfertilization (dpf) (DE1; outlined with blue) compared with the relative expression of these top 10 SLCs in the proximal convoluted tubule (PC1), proximal straight tubule (PS1), distal late tubule (DL1), and pronephric duct (PD1) as well as their expression at 2 dpf (PC2, PS2, DE2, DL2, and PD2, respectively) and 3 dpf (PC3, PS3, DE3, DL3, and PD3, respectively). B: 10 most abundant SLCs in DE3 (outlined with red) compared with the relative expression of these top 10 SLCs in PC3, PS3, DL3, and PD3 as well as their expression at 1 dpf and 2 dpf. C: relative change in expression between 1 dpf and 3 dpf for the top 10 candidates identified in the distal early tubule at 1 dpf and 3 dpf. Blue labeled bars indicate ≥60% abundance at 1 dpf; red labeled bars indicate ≥60% abundance at 3 dpf. The light blue and red bars correspond to <60% abundance. D: 10 most abundant SLCs in DL1 (outlined with blue) compared with the relative expression of these top 10 SLCs in PC1, PS1, DE1, and PD1 as well as their expression at 2 dpf and 3 dpf. E: 10 most abundant SLCs in DL3 (outlined with red) compared with the relative expression of these top 10 SLCs in PC3, PS3, DE3, and PD3 as well as their expression at 1 dpf and 2 dpf. F: relative change in expression between 1 dpf and 3 dpf for the top 10 candidates identified in the distal late tubule at 1 dpf and 3 dpf. Blue labeled bars indicate ≥60% abundance at 1 dpf; red labeled bars indicate ≥60% abundance at 3 dpf. The light blue and red bars correspond to <60% abundance. PC3; pronephric cells. |
|
Expression of solute carriers (SLCs) in the pronephric duct of the developing zebrafish pronephros. A: 10 most abundant SLCs in the pronephric duct at 1 day postfertilization (dpf) (PD1) compared with the relative expression of these top 10 SLCs in the proximal convoluted tubule (PC1), proximal straight tubule (PS1), distal early tubule (DE1), and distal late tubule (DL1) as well as their expression at 2 dpf (PC2, PS2, DE2, DL2, and PD2, respectively) and 3 dpf (PC3, PS3, DE3, DL3, and PD3, respectively). B: 10 most abundant SLCs in PD3 compared with the relative expression of these top 10 SLCs in PC3, PS3, DE3, and DL3 as well as their expression at 1 dpf and 2 dpf. C: relative change in expression between 1 dpf and 3 dpf for the top 10 candidates identified in the pronephric duct at 1 dpf and 3 dpf. Green labeled bars indicate ≥60% abundance at 1 dpf; red labeled bars indicate ≥60% abundance at 3 dpf. The light green and red bars correspond to <60% abundance. D: comparison of the top 40 genes expressed 3 dpf in the proximal convoluted tubule and pronephric duct. Genes were sorted for PC3; overlapping genes were only represented once. The comparison revealed high expression of selenoprotein P (sepp1a) and megalin (lrp2) in the proximal segments, whereas proteins involved in apoptosis (atg16l1) and vesicular transport (vstm2l and cplx4b) were expressed at higher levels in the distal pronephros. PC3; pronephric cells. |
|
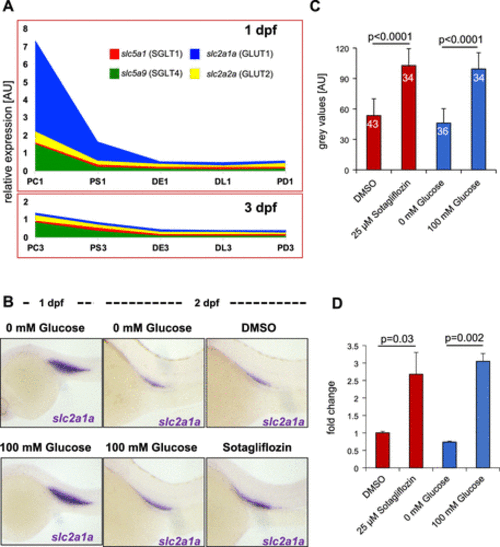
Rapid decline of glucose-transporting capacity during zebrafish pronephros development. A: glucose carriers of the glucose transporter (GLUT) and Na+-glucose transporter (SGLT) gene families rapidly declined after the first 24 h of development. Compared with 1 day postfertilization (dpf), very reduced expression of glucose transporters remained at 3 dpf. PC1, PS1, DE1, DL1, and PD1, proximal convoluted tubule, proximal straight tubule, distal early tubule, distal late tubule, and pronephric duct at 1 dpf; PC3, PS3, DE3, DL3, and PD3, proximal convoluted tubule, proximal straight tubule, distal early tubule, distal late tubule, and pronephric duct at 3 dpf. B: environmental glucose affects expression of glucose carriers. Although high-glucose concentrations (100 mM) had no effect on the expression of slc2a1 (GLUT1) at 1 dpf, glucose antagonized the downregulation of slc2a1a at 2 dpf. The SGLT inhibitor sotagliflozin also prevented downregulation of slc2a1a. C: quantification of the whole-mount in situ hybridization data shown in B. The numbers within the bars show the total number of analyzed embryos. The error bars indicate SDs. P values were calculated with a Student’s t test. D: quantitative RT-PCR for slc2a1a at 2 dpf confirmed the results from the whole-mount in situ hybridization quantification: high environmental glucose or sotagliflozin treatment maintained high levels of slc2a1a expression. P values were calculated with a Student’s t test. DE1, distal early tubule; DL1, distal late tubule; PC3; pronephric cells; PD1, pronephric duct; PS1, proximal straight tubule; SLCs, solute carriers. |
|
Inhibition of monocarboxylate transport prevents downregulation of glucose (Gluc) carriers. Although environmental glucose at concentrations between 5 and 20 mM had no clear effect, inhibition of SLC16 family members by BAY 8002 (BAY) at 5 µM resulted in a significant upregulation of slc2a1a. This upregulation was ameliorated by the addition of glucose in a dose-dependent fashion, suggesting that blocking the ability to use monocarboxylates as substrates augments the reliance on glucose as substrate for tissue homeostasis. A: representative images of whole-mount in situ hybridization (WISH) for slc2a1a under the indicated conditions. B: quantification of the WISH data shown in A. The numbers above the bars indicate the counts of analyzed embryos. Significance was calculated using a two-sided t test. C: quantitative RT-PCR for slc2a1a of embryos treated with BAY 8002 or BAY 8002 + glucose confirmed the findings from the WISH experiments: the upregulated expression of slc2a1a in the presence of BAY 8002 was normalized by the addition of glucose. P values were calculated using a Student’s t test. Gluc, glucose; SLC, solute carrier; WISH, whole-mount in situ hybridization. |


