FIGURE SUMMARY
Title

MicroRNA-21 Plays Multiple Oncometabolic Roles in the Process of NAFLD-Related Hepatocellular Carcinoma via PI3K/AKT, TGF-β, and STAT3 Signaling

Authors
Lai, C.Y., Yeh, K.Y., Lin, C.Y., Hsieh, Y.W., Lai, H.H., Chen, J.R., Hsu, C.C., Her, G.M.
Source
Full text @ Cancers

Generation of a liver specific and inducible microRNA (miR)-21 transgenic zebrafish. (A) Schematic diagram of the DNA construct used to generate LmiR21 [Tg(fabp10a-Teton-2A-ZsGreen:mCherry-miR-21)] transgenic zebrafish. Fabp10a promoter drives expression of ZsGreen and tetracycline-inducible transcription factor (Tet-on/off), which controls mCherry and miR-21 expression. (B) Relative quantification of miR-21 expression using (RT-qPCR) analysis. LmiR21#1-5+doxycycline (Dox) represent five independent transgenic lines. Control: wild-type (WT)-Dox and LmiR21#1-5-Dox zebrafish. (C) Liver-specific inducible miR-21 expression in the LmiR21#1 7 days post fertilization (dpf). Transgenic larvae were treated with 25 μg/mL Dox from 48 or 72 h post fertilization (hpf) to 7 dpf. Scale bar: 100 μm. (D) Left: images of zebrafish liver; right: 2D measurements of liver area using ImageJ. Scale bar: 50 μm. (E) Representative photomicrographs of IHC detection of cell proliferation marker-PCNA in zebrafish liver (Left). Scale bar: 50 μm; Statistical analysis of the percentage of PCNA-positive field. Statistically significant differences from −Dox group were denoted by * (p < 0.05), ** (p < 0.01) and *** (p < 0.001) for panel D and E.

Generation of a liver specific and inducible microRNA (miR)-21 transgenic zebrafish. (A) Schematic diagram of the DNA construct used to generate LmiR21 [Tg(fabp10a-Teton-2A-ZsGreen:mCherry-miR-21)] transgenic zebrafish. Fabp10a promoter drives expression of ZsGreen and tetracycline-inducible transcription factor (Tet-on/off), which controls mCherry and miR-21 expression. (B) Relative quantification of miR-21 expression using (RT-qPCR) analysis. LmiR21#1-5+doxycycline (Dox) represent five independent transgenic lines. Control: wild-type (WT)-Dox and LmiR21#1-5-Dox zebrafish. (C) Liver-specific inducible miR-21 expression in the LmiR21#1 7 days post fertilization (dpf). Transgenic larvae were treated with 25 μg/mL Dox from 48 or 72 h post fertilization (hpf) to 7 dpf. Scale bar: 100 μm. (D) Left: images of zebrafish liver; right: 2D measurements of liver area using ImageJ. Scale bar: 50 μm. (E) Representative photomicrographs of IHC detection of cell proliferation marker-PCNA in zebrafish liver (Left). Scale bar: 50 μm; Statistical analysis of the percentage of PCNA-positive field. Statistically significant differences from −Dox group were denoted by * (p < 0.05), ** (p < 0.01) and *** (p < 0.001) for panel D and E.

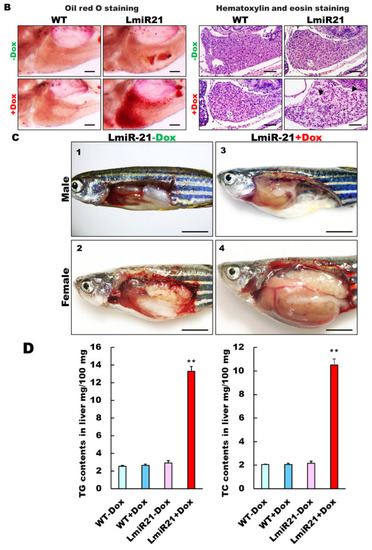
Characterization of hepatic steatosis in LmiR21 larvae and adult. (A) Whole-mount oil-red O (ORO) staining of WT ± Dox and LmiR21 ± Dox larvae at 21 dpf. Lipid contents in livers and swim bladders were stained by ORO (up). Scale bar: 2 mm. Percentages of WT ± Dox and LmiR21 ± Dox larvae with weak, moderate and strong levels of hepatic steatosis at 21 dpf (down). Scale bar: 200 μm. (B) Representative ORO images of liver in 21 dpf larvae (left). Scale bar: 500 μm. Hematoxylin-eosin (H&E) staining of livers at 21 dpf LmiR21 + Dox larvae show abnormally shaped hepatocytes with lipid vacuoles (arrows) compared with that in the controls at the same stage. Scale bar: 100 μm. (right). (C) Gross liver phenotypes at 4 months post fertilization (mpf) LmiR21 ± Dox. Normal hepatic morphology is clearly composed of lobes in LmiR21 − Dox adult (panels 1,2). Liver hyperplasia with yellow and greasy phenotypes in LmiR21 + Dox adult liver (panels 3,4). Scale bar: 5 mm. (D) Triglyceride (TG) and total cholesterol (TC) in the livers is greater in LmiR21 + Dox than in the controls (n = 3). Statistically significant differences from LmiR21 − Dox were denoted by ** (p < 0.01). (E) H&E staining of liver tissue from WT ± Dox and LmiR21 ± Dox at 4 mpf depicting morphological changes resulting from accumulation of microvesicular steatosis. Scale bar: 50 μm. (left). ORO staining of liver cryosections from WT ± Dox and LmiR21 ± Dox adults at 4 mpf. Scale bar: 50 μm. An abundance of lipid accumulation is observed in LmiR21 + Dox compared to that in controls. (right). (F) Representative liver sections showing ballooned hepatocytes (large arrow) and lipid vacuoles (star) with Masson’s trichrome (left), and Picrosirius red (right). Scale bar: 50 μm.

Characterization of hepatic steatosis in LmiR21 larvae and adult. (A) Whole-mount oil-red O (ORO) staining of WT ± Dox and LmiR21 ± Dox larvae at 21 dpf. Lipid contents in livers and swim bladders were stained by ORO (up). Scale bar: 2 mm. Percentages of WT ± Dox and LmiR21 ± Dox larvae with weak, moderate and strong levels of hepatic steatosis at 21 dpf (down). Scale bar: 200 μm. (B) Representative ORO images of liver in 21 dpf larvae (left). Scale bar: 500 μm. Hematoxylin-eosin (H&E) staining of livers at 21 dpf LmiR21 + Dox larvae show abnormally shaped hepatocytes with lipid vacuoles (arrows) compared with that in the controls at the same stage. Scale bar: 100 μm. (right). (C) Gross liver phenotypes at 4 months post fertilization (mpf) LmiR21 ± Dox. Normal hepatic morphology is clearly composed of lobes in LmiR21 − Dox adult (panels 1,2). Liver hyperplasia with yellow and greasy phenotypes in LmiR21 + Dox adult liver (panels 3,4). Scale bar: 5 mm. (D) Triglyceride (TG) and total cholesterol (TC) in the livers is greater in LmiR21 + Dox than in the controls (n = 3). Statistically significant differences from LmiR21 − Dox were denoted by ** (p < 0.01). (E) H&E staining of liver tissue from WT ± Dox and LmiR21 ± Dox at 4 mpf depicting morphological changes resulting from accumulation of microvesicular steatosis. Scale bar: 50 μm. (left). ORO staining of liver cryosections from WT ± Dox and LmiR21 ± Dox adults at 4 mpf. Scale bar: 50 μm. An abundance of lipid accumulation is observed in LmiR21 + Dox compared to that in controls. (right). (F) Representative liver sections showing ballooned hepatocytes (large arrow) and lipid vacuoles (star) with Masson’s trichrome (left), and Picrosirius red (right). Scale bar: 50 μm.

Characterization of hepatic steatosis in LmiR21 larvae and adult. (A) Whole-mount oil-red O (ORO) staining of WT ± Dox and LmiR21 ± Dox larvae at 21 dpf. Lipid contents in livers and swim bladders were stained by ORO (up). Scale bar: 2 mm. Percentages of WT ± Dox and LmiR21 ± Dox larvae with weak, moderate and strong levels of hepatic steatosis at 21 dpf (down). Scale bar: 200 μm. (B) Representative ORO images of liver in 21 dpf larvae (left). Scale bar: 500 μm. Hematoxylin-eosin (H&E) staining of livers at 21 dpf LmiR21 + Dox larvae show abnormally shaped hepatocytes with lipid vacuoles (arrows) compared with that in the controls at the same stage. Scale bar: 100 μm. (right). (C) Gross liver phenotypes at 4 months post fertilization (mpf) LmiR21 ± Dox. Normal hepatic morphology is clearly composed of lobes in LmiR21 − Dox adult (panels 1,2). Liver hyperplasia with yellow and greasy phenotypes in LmiR21 + Dox adult liver (panels 3,4). Scale bar: 5 mm. (D) Triglyceride (TG) and total cholesterol (TC) in the livers is greater in LmiR21 + Dox than in the controls (n = 3). Statistically significant differences from LmiR21 − Dox were denoted by ** (p < 0.01). (E) H&E staining of liver tissue from WT ± Dox and LmiR21 ± Dox at 4 mpf depicting morphological changes resulting from accumulation of microvesicular steatosis. Scale bar: 50 μm. (left). ORO staining of liver cryosections from WT ± Dox and LmiR21 ± Dox adults at 4 mpf. Scale bar: 50 μm. An abundance of lipid accumulation is observed in LmiR21 + Dox compared to that in controls. (right). (F) Representative liver sections showing ballooned hepatocytes (large arrow) and lipid vacuoles (star) with Masson’s trichrome (left), and Picrosirius red (right). Scale bar: 50 μm.

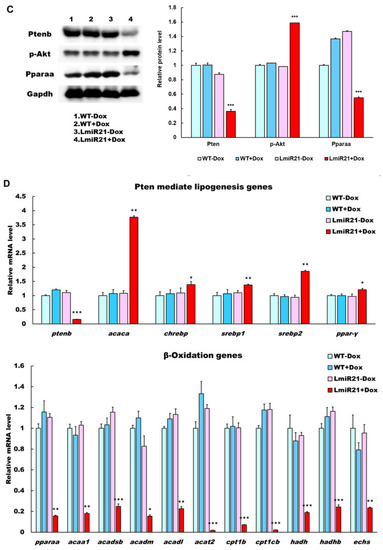
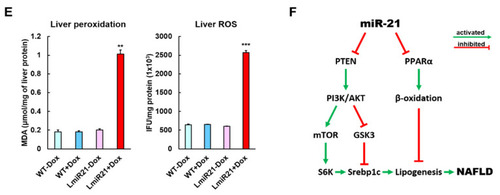
MiR-21 targets ptenb and pparaa levels in hepatocytes, which leads to nonalcoholic fatty liver disease (NAFLD) progression. (A) Schematic alignment between the mature miR-21 seed sequence (red) and (1) ptenb, (2) pparaa mRNA target sequence (blue) at the 3′-UTR. Perfect matches are indicated by a line, and G:U pairs by a colon. (left). Whole mount in situ hybridization (ISH) assays demonstrate that miR-21 significantly represses in vivo expression of (1) ptenb and (2) pparaa mRNA in AmiR + Dox, compared to that in AmiR-Dox (right). Scale bar:1 mm. (B) MiR-21 expression in the livers of WT ± Dox and LmiR21 ± Dox at 4 mpf. mRNA expression levels of ptenb and pparaa mRNA liver of WT ± Dox and LmiR21 ± Dox at 4 mpf. (C) Western blot images (left) and quantitative data (right) of Ptenb, Pparaa and p-Akt in the livers of WT ± Dox and LmiR21 ± Dox at 4 mpf. (D) Increased expression of lipogenic genes in response to pten suppression was greater in LmiR21 + Dox than controls (n = 3). Decreased expression of genes involved in fatty acid β-oxidation in response to pparaa suppression was greater in LmiR21 + Dox than controls (n = 3). (E) Levels of hepatic oxidative stress, MDA, and H2O2 in hepatic mitochondria is also greater in LmiR21 + Dox than in the controls (n = 3). (F) Bilateral-factorial effects of miR-21 in NAFLD acceleration. Statistically significant differences from LmiR21 − Dox were denoted by * (p < 0.05), ** (p < 0.01) and *** (p < 0.001) for panels B–E.

MiR-21 targets ptenb and pparaa levels in hepatocytes, which leads to nonalcoholic fatty liver disease (NAFLD) progression. (A) Schematic alignment between the mature miR-21 seed sequence (red) and (1) ptenb, (2) pparaa mRNA target sequence (blue) at the 3′-UTR. Perfect matches are indicated by a line, and G:U pairs by a colon. (left). Whole mount in situ hybridization (ISH) assays demonstrate that miR-21 significantly represses in vivo expression of (1) ptenb and (2) pparaa mRNA in AmiR + Dox, compared to that in AmiR-Dox (right). Scale bar:1 mm. (B) MiR-21 expression in the livers of WT ± Dox and LmiR21 ± Dox at 4 mpf. mRNA expression levels of ptenb and pparaa mRNA liver of WT ± Dox and LmiR21 ± Dox at 4 mpf. (C) Western blot images (left) and quantitative data (right) of Ptenb, Pparaa and p-Akt in the livers of WT ± Dox and LmiR21 ± Dox at 4 mpf. (D) Increased expression of lipogenic genes in response to pten suppression was greater in LmiR21 + Dox than controls (n = 3). Decreased expression of genes involved in fatty acid β-oxidation in response to pparaa suppression was greater in LmiR21 + Dox than controls (n = 3). (E) Levels of hepatic oxidative stress, MDA, and H2O2 in hepatic mitochondria is also greater in LmiR21 + Dox than in the controls (n = 3). (F) Bilateral-factorial effects of miR-21 in NAFLD acceleration. Statistically significant differences from LmiR21 − Dox were denoted by * (p < 0.05), ** (p < 0.01) and *** (p < 0.001) for panels B–E.

MiR-21 targets ptenb and pparaa levels in hepatocytes, which leads to nonalcoholic fatty liver disease (NAFLD) progression. (A) Schematic alignment between the mature miR-21 seed sequence (red) and (1) ptenb, (2) pparaa mRNA target sequence (blue) at the 3′-UTR. Perfect matches are indicated by a line, and G:U pairs by a colon. (left). Whole mount in situ hybridization (ISH) assays demonstrate that miR-21 significantly represses in vivo expression of (1) ptenb and (2) pparaa mRNA in AmiR + Dox, compared to that in AmiR-Dox (right). Scale bar:1 mm. (B) MiR-21 expression in the livers of WT ± Dox and LmiR21 ± Dox at 4 mpf. mRNA expression levels of ptenb and pparaa mRNA liver of WT ± Dox and LmiR21 ± Dox at 4 mpf. (C) Western blot images (left) and quantitative data (right) of Ptenb, Pparaa and p-Akt in the livers of WT ± Dox and LmiR21 ± Dox at 4 mpf. (D) Increased expression of lipogenic genes in response to pten suppression was greater in LmiR21 + Dox than controls (n = 3). Decreased expression of genes involved in fatty acid β-oxidation in response to pparaa suppression was greater in LmiR21 + Dox than controls (n = 3). (E) Levels of hepatic oxidative stress, MDA, and H2O2 in hepatic mitochondria is also greater in LmiR21 + Dox than in the controls (n = 3). (F) Bilateral-factorial effects of miR-21 in NAFLD acceleration. Statistically significant differences from LmiR21 − Dox were denoted by * (p < 0.05), ** (p < 0.01) and *** (p < 0.001) for panels B–E.

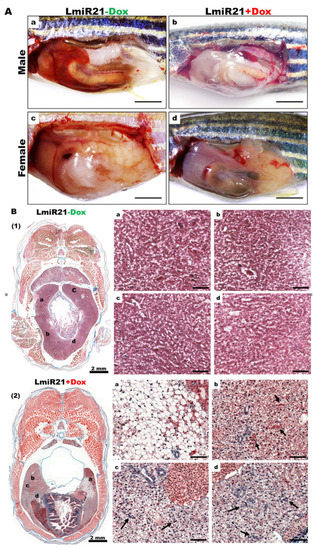
Development of nonalcoholic steatohepatitis (NASH) phenotypes in LmiR-21 zebrafish at 6 mpf. (A) Gross liver images of (a) LmiR21 − Dox male, (b) LmiR21 + Dox male, (c) LmiR21 − Dox female, (d) LmiR21 + Dox female. Scale bar: 3 mm. (B) Representative images of Masson’s trichrome staining of steatohepatitis in livers of (1) LmiR21 − Dox (insets a-d) and (2) LmiR21 + Dox; Insets: (a) hepatocyte ballooning, (b) Mallory-Denk bodies (MDBs) are indicated by arrows, and (c,d) lobular inflammation is indicated by arrows. Scale bar: 50 μm. (C) Representative images of Masson’s trichrome staining of fibrotic liver tissue from LmiR21 + Dox; Insets: (a,b) MDBs concomitant with fibrosis (red arrows) and scar tissue associated with liver fibrosis (yellow arrows) and (c,d) lobular inflammation concomitant with blue collagen (blue arrows). Scale bar: 50 μm. (D) Induction of proinflammatory gene expressions in response to inflammation was significantly greater in LmiR21 + Dox than in controls (n = 3). Statistically significant differences from LmiR21 − Dox were denoted by * (p < 0.05), ** (p < 0.01).

Development of nonalcoholic steatohepatitis (NASH) phenotypes in LmiR-21 zebrafish at 6 mpf. (A) Gross liver images of (a) LmiR21 − Dox male, (b) LmiR21 + Dox male, (c) LmiR21 − Dox female, (d) LmiR21 + Dox female. Scale bar: 3 mm. (B) Representative images of Masson’s trichrome staining of steatohepatitis in livers of (1) LmiR21 − Dox (insets a-d) and (2) LmiR21 + Dox; Insets: (a) hepatocyte ballooning, (b) Mallory-Denk bodies (MDBs) are indicated by arrows, and (c,d) lobular inflammation is indicated by arrows. Scale bar: 50 μm. (C) Representative images of Masson’s trichrome staining of fibrotic liver tissue from LmiR21 + Dox; Insets: (a,b) MDBs concomitant with fibrosis (red arrows) and scar tissue associated with liver fibrosis (yellow arrows) and (c,d) lobular inflammation concomitant with blue collagen (blue arrows). Scale bar: 50 μm. (D) Induction of proinflammatory gene expressions in response to inflammation was significantly greater in LmiR21 + Dox than in controls (n = 3). Statistically significant differences from LmiR21 − Dox were denoted by * (p < 0.05), ** (p < 0.01).

MiR-21 targets smad7 and ptenb in hepatocytes and leads to fibrogenesis. (A) Schematic alignment between the mature miR-21 seed sequence (red) and the smad7 mRNA target sequence (blue) at the 3-UTR. Perfect matches are indicated by a line, and G:U pairs by a colon. Whole mount in situ hybridization assays show significant repression of smad7 mRNA by miR-21 in AmiR+Dox, as compared to AmiR21 − Dox. Scale bar: 1 mm. (B) RT-qPCR analysis of smad7 and ptenb mRNA expression in the liver of WT ± Dox and LmiR21 ± Dox fish at 8 mpf. (C) Representative Western blots of Smad7 and PTEN in livers of WT ± Dox and LmiR21 ± Dox at 8 mpf. (D) Representative images of Masson’s trichrome and Picrosirius red staining of liver tissue from WT±Dox and LmiR21 ± Dox at 8 mpf depicting the individual components of advanced fibrosis (as indicated): portal and periportal fibrosis, bridging fibrosis and cirrhosis. Scale bar: 50 μm. (E) Increased expression of HSC and fibrotic genes in response to Smad7 and PTEN suppression was significantly greater in LmiR21 + Dox at 8 mpf than controls (n = 3). (F) Bilateral-factorial effects of miR-21 in fibrogenesis activation. Statistically significant differences from LmiR21 − Dox are denoted by * (p < 0.05), ** (p < 0.01) and *** (p < 0.001) for panels B, C and E.

MiR-21 targets smad7 and ptenb in hepatocytes and leads to fibrogenesis. (A) Schematic alignment between the mature miR-21 seed sequence (red) and the smad7 mRNA target sequence (blue) at the 3-UTR. Perfect matches are indicated by a line, and G:U pairs by a colon. Whole mount in situ hybridization assays show significant repression of smad7 mRNA by miR-21 in AmiR+Dox, as compared to AmiR21 − Dox. Scale bar: 1 mm. (B) RT-qPCR analysis of smad7 and ptenb mRNA expression in the liver of WT ± Dox and LmiR21 ± Dox fish at 8 mpf. (C) Representative Western blots of Smad7 and PTEN in livers of WT ± Dox and LmiR21 ± Dox at 8 mpf. (D) Representative images of Masson’s trichrome and Picrosirius red staining of liver tissue from WT±Dox and LmiR21 ± Dox at 8 mpf depicting the individual components of advanced fibrosis (as indicated): portal and periportal fibrosis, bridging fibrosis and cirrhosis. Scale bar: 50 μm. (E) Increased expression of HSC and fibrotic genes in response to Smad7 and PTEN suppression was significantly greater in LmiR21 + Dox at 8 mpf than controls (n = 3). (F) Bilateral-factorial effects of miR-21 in fibrogenesis activation. Statistically significant differences from LmiR21 − Dox are denoted by * (p < 0.05), ** (p < 0.01) and *** (p < 0.001) for panels B, C and E.

Increased susceptibility of LmiR21 zebrafish to diethylnitrosamine (DEN)-induced liver fibrosis and carcinogenesis. (A) Experimental design of three independent DEN treatments and doxycycline (Dox) dosing. (B) Representative images of livers with microscopic tumors identified following hematoxylin & eosin staining (indicated with arrows) one, three, and nine months after DEN treatment. Scale bar: 100 μm. (C) Representative images of livers with microscopic injuries identified by Masson’s trichome staining at one, three, and nine months after DEN treatment. Scale bar: 50 μm. (D) Representative images of livers with microscopic injuries identified by Sirius red staining at one, three, and nine months after DEN treatment. Scale bar: 50 μm.

Increased susceptibility of LmiR21 zebrafish to diethylnitrosamine (DEN)-induced liver fibrosis and carcinogenesis. (A) Experimental design of three independent DEN treatments and doxycycline (Dox) dosing. (B) Representative images of livers with microscopic tumors identified following hematoxylin & eosin staining (indicated with arrows) one, three, and nine months after DEN treatment. Scale bar: 100 μm. (C) Representative images of livers with microscopic injuries identified by Masson’s trichome staining at one, three, and nine months after DEN treatment. Scale bar: 50 μm. (D) Representative images of livers with microscopic injuries identified by Sirius red staining at one, three, and nine months after DEN treatment. Scale bar: 50 μm.

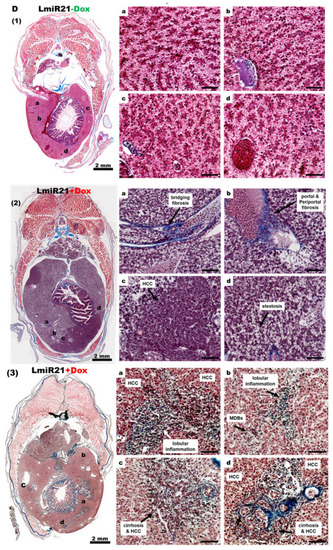
LmiR21 zebrafish develop nonalcoholic hepatocellular carcinoma (NAHCC) phenotypes at 10 months post fertilization (mpf). (A) Gross liver images from (a) LmiR21 − Dox male, (b) LmiR-21 + Dox male, (c) LmiR21 − Dox female, and (d) LmiR21 + Dox female. Scale bar: 3 mm. (B) Microscopic views of angiogenesis in livers from bright field: (a) LmiR21 − Dox (c) LmiR21 + Dox and corresponding GFP fluorescence images (b) LmiR21 − Dox (d) LmiR21 + Dox. Scale bar: 2 mm. (C) Hematoxylin & eosin stained livers from (1) LmiR21 − Dox (insets ad) (2) LmiR21 + Dox (insets ad) of steatohepatitis concomitant with HCC: hepatocyte ballooning, Mallory−Denk bodies (MDB), lobular inflammation and HCC (indicated by arrows). Scale bar: 50 μm. (D) Masson’s trichrome stained livers of (1) LmiR21 − Dox (insets ad), (2) LmiR21 + Dox (insets ad) indicative of steatohepatitis, portal and periportal fibrosis concomitant with HCC and (3) LmiR21 + Dox (insets ad) indicative of steatohepatitis, advanced fibrosis (cirrhosis) concomitant with HCC. Scale bar: 50 μm. (E) Analysis of selected miR-21 targeted NAHCC associated genes: HMG-box transcription factor 1 (hbp1), 3-hydroxy-3-methylglutaryl-CoA reductase (hmgcr), fatty acid binding protein 7a (fabp7a), programmed cell death 4b (pdcd4b), and tissue inhibitors of metalloproteinases 3 (timp3). (1) Schematic alignment between the mature miR-21 seed sequence and the mRNA target sequence at the 3′ UTR. (2) Whole mount in situ hybridization assays demonstrate that miR-21 significantly represses expression of NAHCC associated genes in AmiR21 fish. Scale bar: 1 mm. (3) RT-qPCR analysis of the NAHCC associated genes mRNA expression in the liver of WT ± Dox and LmiR21 ± Dox at 10 mpf. Statistically significant differences from LmiR21 − Dox were denoted by ** (p < 0.01) and *** (p < 0.001).

LmiR21 zebrafish develop nonalcoholic hepatocellular carcinoma (NAHCC) phenotypes at 10 months post fertilization (mpf). (A) Gross liver images from (a) LmiR21 − Dox male, (b) LmiR-21 + Dox male, (c) LmiR21 − Dox female, and (d) LmiR21 + Dox female. Scale bar: 3 mm. (B) Microscopic views of angiogenesis in livers from bright field: (a) LmiR21 − Dox (c) LmiR21 + Dox and corresponding GFP fluorescence images (b) LmiR21 − Dox (d) LmiR21 + Dox. Scale bar: 2 mm. (C) Hematoxylin & eosin stained livers from (1) LmiR21 − Dox (insets ad) (2) LmiR21 + Dox (insets ad) of steatohepatitis concomitant with HCC: hepatocyte ballooning, Mallory−Denk bodies (MDB), lobular inflammation and HCC (indicated by arrows). Scale bar: 50 μm. (D) Masson’s trichrome stained livers of (1) LmiR21 − Dox (insets ad), (2) LmiR21 + Dox (insets ad) indicative of steatohepatitis, portal and periportal fibrosis concomitant with HCC and (3) LmiR21 + Dox (insets ad) indicative of steatohepatitis, advanced fibrosis (cirrhosis) concomitant with HCC. Scale bar: 50 μm. (E) Analysis of selected miR-21 targeted NAHCC associated genes: HMG-box transcription factor 1 (hbp1), 3-hydroxy-3-methylglutaryl-CoA reductase (hmgcr), fatty acid binding protein 7a (fabp7a), programmed cell death 4b (pdcd4b), and tissue inhibitors of metalloproteinases 3 (timp3). (1) Schematic alignment between the mature miR-21 seed sequence and the mRNA target sequence at the 3′ UTR. (2) Whole mount in situ hybridization assays demonstrate that miR-21 significantly represses expression of NAHCC associated genes in AmiR21 fish. Scale bar: 1 mm. (3) RT-qPCR analysis of the NAHCC associated genes mRNA expression in the liver of WT ± Dox and LmiR21 ± Dox at 10 mpf. Statistically significant differences from LmiR21 − Dox were denoted by ** (p < 0.01) and *** (p < 0.001).

LmiR21 zebrafish develop nonalcoholic hepatocellular carcinoma (NAHCC) phenotypes at 10 months post fertilization (mpf). (A) Gross liver images from (a) LmiR21 − Dox male, (b) LmiR-21 + Dox male, (c) LmiR21 − Dox female, and (d) LmiR21 + Dox female. Scale bar: 3 mm. (B) Microscopic views of angiogenesis in livers from bright field: (a) LmiR21 − Dox (c) LmiR21 + Dox and corresponding GFP fluorescence images (b) LmiR21 − Dox (d) LmiR21 + Dox. Scale bar: 2 mm. (C) Hematoxylin & eosin stained livers from (1) LmiR21 − Dox (insets ad) (2) LmiR21 + Dox (insets ad) of steatohepatitis concomitant with HCC: hepatocyte ballooning, Mallory−Denk bodies (MDB), lobular inflammation and HCC (indicated by arrows). Scale bar: 50 μm. (D) Masson’s trichrome stained livers of (1) LmiR21 − Dox (insets ad), (2) LmiR21 + Dox (insets ad) indicative of steatohepatitis, portal and periportal fibrosis concomitant with HCC and (3) LmiR21 + Dox (insets ad) indicative of steatohepatitis, advanced fibrosis (cirrhosis) concomitant with HCC. Scale bar: 50 μm. (E) Analysis of selected miR-21 targeted NAHCC associated genes: HMG-box transcription factor 1 (hbp1), 3-hydroxy-3-methylglutaryl-CoA reductase (hmgcr), fatty acid binding protein 7a (fabp7a), programmed cell death 4b (pdcd4b), and tissue inhibitors of metalloproteinases 3 (timp3). (1) Schematic alignment between the mature miR-21 seed sequence and the mRNA target sequence at the 3′ UTR. (2) Whole mount in situ hybridization assays demonstrate that miR-21 significantly represses expression of NAHCC associated genes in AmiR21 fish. Scale bar: 1 mm. (3) RT-qPCR analysis of the NAHCC associated genes mRNA expression in the liver of WT ± Dox and LmiR21 ± Dox at 10 mpf. Statistically significant differences from LmiR21 − Dox were denoted by ** (p < 0.01) and *** (p < 0.001).

LmiR21 zebrafish develop nonalcoholic hepatocellular carcinoma (NAHCC) phenotypes at 10 months post fertilization (mpf). (A) Gross liver images from (a) LmiR21 − Dox male, (b) LmiR-21 + Dox male, (c) LmiR21 − Dox female, and (d) LmiR21 + Dox female. Scale bar: 3 mm. (B) Microscopic views of angiogenesis in livers from bright field: (a) LmiR21 − Dox (c) LmiR21 + Dox and corresponding GFP fluorescence images (b) LmiR21 − Dox (d) LmiR21 + Dox. Scale bar: 2 mm. (C) Hematoxylin & eosin stained livers from (1) LmiR21 − Dox (insets ad) (2) LmiR21 + Dox (insets ad) of steatohepatitis concomitant with HCC: hepatocyte ballooning, Mallory−Denk bodies (MDB), lobular inflammation and HCC (indicated by arrows). Scale bar: 50 μm. (D) Masson’s trichrome stained livers of (1) LmiR21 − Dox (insets ad), (2) LmiR21 + Dox (insets ad) indicative of steatohepatitis, portal and periportal fibrosis concomitant with HCC and (3) LmiR21 + Dox (insets ad) indicative of steatohepatitis, advanced fibrosis (cirrhosis) concomitant with HCC. Scale bar: 50 μm. (E) Analysis of selected miR-21 targeted NAHCC associated genes: HMG-box transcription factor 1 (hbp1), 3-hydroxy-3-methylglutaryl-CoA reductase (hmgcr), fatty acid binding protein 7a (fabp7a), programmed cell death 4b (pdcd4b), and tissue inhibitors of metalloproteinases 3 (timp3). (1) Schematic alignment between the mature miR-21 seed sequence and the mRNA target sequence at the 3′ UTR. (2) Whole mount in situ hybridization assays demonstrate that miR-21 significantly represses expression of NAHCC associated genes in AmiR21 fish. Scale bar: 1 mm. (3) RT-qPCR analysis of the NAHCC associated genes mRNA expression in the liver of WT ± Dox and LmiR21 ± Dox at 10 mpf. Statistically significant differences from LmiR21 − Dox were denoted by ** (p < 0.01) and *** (p < 0.001).

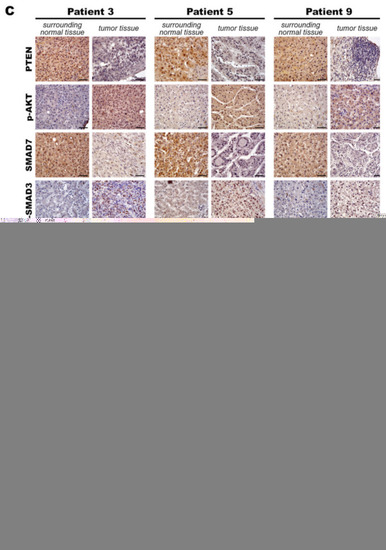
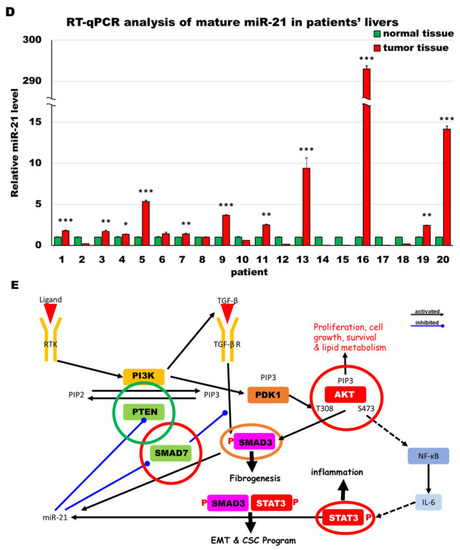
MiR-21 expression shows a direct correlation with activation of PI3K, TGF-β and STAT3 (PTS) signaling network proteins in LmiR21 zebrafish and human nonviral hepatocellular carcinomas (HCC). (A) Expression patterns of Ptenb, p-Akt, Smad7, p-Smad3 and p-Stat3 in 10 mpf LmiR21 ± Dox liver samples after immunohistochemical (IHC) staining. Scale bar: 50 μm. Positive signal areas per field were quantified. (B) Western blot images (left) and quantitative data (right) of PTS signaling regulatory protein in 10 mpf LmiR21 ± Dox liver. (C) Human nonviral HCC samples (n = 20) were subjected to IHC of PTEN, p-AKT, SMAD7, p-SMAD3 and p-STAT3 expression. Scale bar: 50 μm. (D) miR-21 expression profiles in the surrounding normal and liver cancer tissues from nonviral HCC patients (n = 20) were analyzed by RT-qPCR. Positive correlation of miR-21 with PTS signaling regulatory genes in 60% of the nonviral HCC samples were observed. (E) Proposed mechanism by which miR-21 links the NAHCC development. MiR-21 mediates a newly discovered PI3K/Akt, TGF-β/Smad3 and Stat3 (PTS) signaling loop and feed forward loop involving Smad3/Stat3 dependent on miR-21 expression. (Abbreviations: →: activated, ─●: inhibited) Statistically significant differences from LmiR21 − Dox were denoted by * (p < 0.05), ** (p < 0.01) and *** (p < 0.001) for panels A, B and D.

MiR-21 expression shows a direct correlation with activation of PI3K, TGF-β and STAT3 (PTS) signaling network proteins in LmiR21 zebrafish and human nonviral hepatocellular carcinomas (HCC). (A) Expression patterns of Ptenb, p-Akt, Smad7, p-Smad3 and p-Stat3 in 10 mpf LmiR21 ± Dox liver samples after immunohistochemical (IHC) staining. Scale bar: 50 μm. Positive signal areas per field were quantified. (B) Western blot images (left) and quantitative data (right) of PTS signaling regulatory protein in 10 mpf LmiR21 ± Dox liver. (C) Human nonviral HCC samples (n = 20) were subjected to IHC of PTEN, p-AKT, SMAD7, p-SMAD3 and p-STAT3 expression. Scale bar: 50 μm. (D) miR-21 expression profiles in the surrounding normal and liver cancer tissues from nonviral HCC patients (n = 20) were analyzed by RT-qPCR. Positive correlation of miR-21 with PTS signaling regulatory genes in 60% of the nonviral HCC samples were observed. (E) Proposed mechanism by which miR-21 links the NAHCC development. MiR-21 mediates a newly discovered PI3K/Akt, TGF-β/Smad3 and Stat3 (PTS) signaling loop and feed forward loop involving Smad3/Stat3 dependent on miR-21 expression. (Abbreviations: →: activated, ─●: inhibited) Statistically significant differences from LmiR21 − Dox were denoted by * (p < 0.05), ** (p < 0.01) and *** (p < 0.001) for panels A, B and D.

MiR-21 expression shows a direct correlation with activation of PI3K, TGF-β and STAT3 (PTS) signaling network proteins in LmiR21 zebrafish and human nonviral hepatocellular carcinomas (HCC). (A) Expression patterns of Ptenb, p-Akt, Smad7, p-Smad3 and p-Stat3 in 10 mpf LmiR21 ± Dox liver samples after immunohistochemical (IHC) staining. Scale bar: 50 μm. Positive signal areas per field were quantified. (B) Western blot images (left) and quantitative data (right) of PTS signaling regulatory protein in 10 mpf LmiR21 ± Dox liver. (C) Human nonviral HCC samples (n = 20) were subjected to IHC of PTEN, p-AKT, SMAD7, p-SMAD3 and p-STAT3 expression. Scale bar: 50 μm. (D) miR-21 expression profiles in the surrounding normal and liver cancer tissues from nonviral HCC patients (n = 20) were analyzed by RT-qPCR. Positive correlation of miR-21 with PTS signaling regulatory genes in 60% of the nonviral HCC samples were observed. (E) Proposed mechanism by which miR-21 links the NAHCC development. MiR-21 mediates a newly discovered PI3K/Akt, TGF-β/Smad3 and Stat3 (PTS) signaling loop and feed forward loop involving Smad3/Stat3 dependent on miR-21 expression. (Abbreviations: →: activated, ─●: inhibited) Statistically significant differences from LmiR21 − Dox were denoted by * (p < 0.05), ** (p < 0.01) and *** (p < 0.001) for panels A, B and D.

Acknowledgments
This image is the copyrighted work of the attributed author or publisher, and ZFIN has permission only to display this image to its users. Additional permissions should be obtained from the applicable author or publisher of the image. Full text @ Cancers