
- Title
-
Corticotropin-releasing hormone reduces basal estradiol production in zebrafish follicular cells
- Authors
- Zhou, H., Chen, A., Lu, W.
- Source
- Full text @ Mol. Cell. Endocrinol.
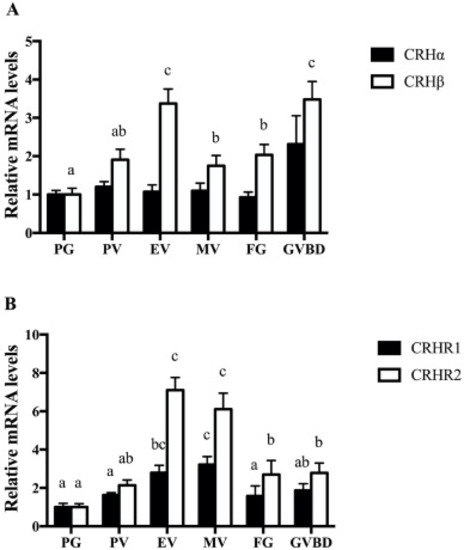
Expression patterns of CRH family during folliculogenesis. The healthy follicles at different developmental stages were collected from female zebrafish and used to extract total RNA. The mRNA levels of CRH and CRHR were detected by qPCR. The data were represented as the mean ± SEM (n = 4). Different lowercase above columns indicates statistical significance (P < 0.05). |
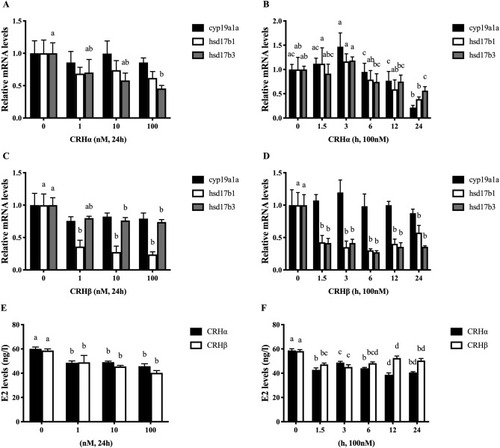
Regulation of steroidogenic gene expression levels and E2 content in zebrafish follicular cells in vitro by CRH. (A and C) Treating primary cultured follicular cells with different concentrations of CRHα or CRHβ for 24 h mRNA expression of cyp19a1a, hsd17b1, and hsd17b3 were detected using qPCR, respectively. (B and D) Treating primary cultured follicular cells with 100 nM CRHα or CRHβ for 1.5–24 h. (E and F) Primary cultured follicular cells incubated with various concentrations of CRHα or CRHβ for 24 h, or with 100 nM CRHα or CRHβ for 1.5–24 h. The content of E2 in the medium was measured by ELISA. The data were represented as the mean ± SEM (n = 4). Different lowercase above columns indicates statistical significance (P < 0.05). |
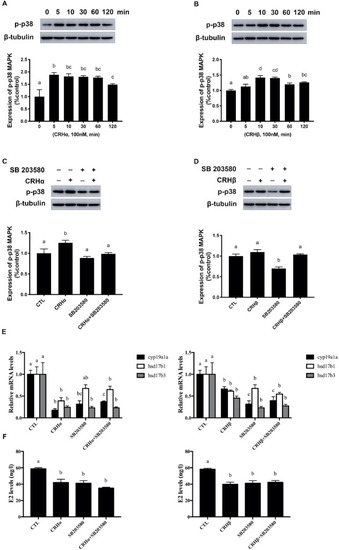
CRH activates p38 MAPK pathways to regulate steroidogenic gene expression and estradiol levels. (A and B) Follicular cells were treated with 100 nM CRHα or CRHβ for 5–120 min. Phospho-p38 MAPK (p-p38 MAPK) and β-tubulin were detected by Western blotting (n = 3). Representative blots and quantified graphs are shown. (C and D) Follicular cells were treated with or without p38 MAPK inhibitors (SB203580) (10 μM) for 1 h, followed by CRHα or CRHβ treatment for 5 min and 10 min, respectively. (E and F) Follicular cells were treated with or without CRHα or CRHβ (100 nM) in the presence or absence of SB 203580 for 24 h. The mRNA expression of cyp19a1a, hsd17b1, and hsd17b3 were detected using qPCR (n = 4). The content of E2 in the medium was measured by ELISA (n = 4). Different lowercase above columns indicates statistical significance (P < 0.05). |
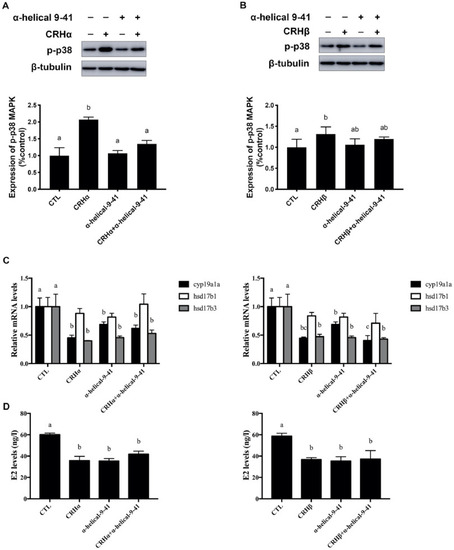
CRHR mediates the effects of CRH on zebrafish ovary. (A and B) Follicular cells were treated with or without CRHR inhibitor (α-helical 9–41) (10 μM) for 1 h, followed by 100 nM CRHα or 100 nM CRHβ treatment for 5 min and 10 min, respectively. Representative blots and quantified graphs (n = 3) are shown. (C and D) Follicular cells were treated with or without CRHα or CRHβ (100 nM) in the presence or absence of α-helical 9–41 for 24 h. The mRNA expression of cyp19a1a, hsd17b1, and hsd17b3 were detected using qPCR (n = 4). The content of E2 in the medium was measured by ELISA (n = 4). Different lowercase above columns indicates statistical significance (P < 0.05). |
Reprinted from Molecular and Cellular Endocrinology, 527, Zhou, H., Chen, A., Lu, W., Corticotropin-releasing hormone reduces basal estradiol production in zebrafish follicular cells, 111222, Copyright (2021) with permission from Elsevier. Full text @ Mol. Cell. Endocrinol.