
|
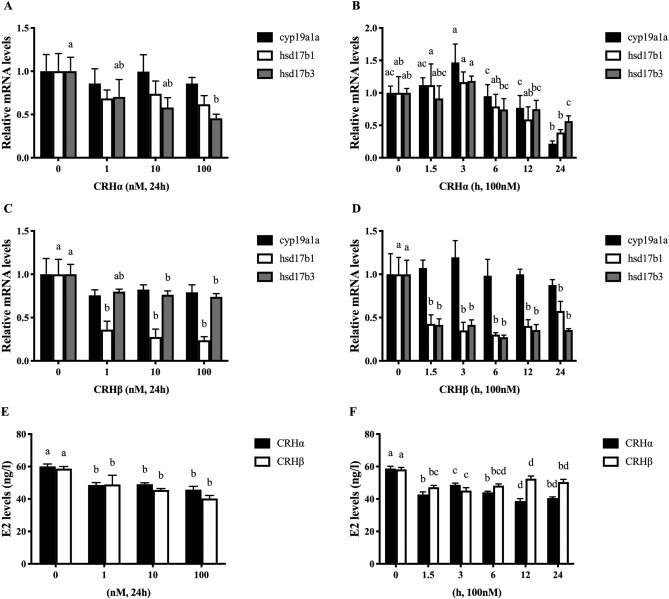
Fig. 2 Regulation of steroidogenic gene expression levels and E2 content in zebrafish follicular cells in vitro by CRH. (A and C) Treating primary cultured follicular cells with different concentrations of CRHα or CRHβ for 24 h mRNA expression of cyp19a1a, hsd17b1, and hsd17b3 were detected using qPCR, respectively. (B and D) Treating primary cultured follicular cells with 100 nM CRHα or CRHβ for 1.5–24 h. (E and F) Primary cultured follicular cells incubated with various concentrations of CRHα or CRHβ for 24 h, or with 100 nM CRHα or CRHβ for 1.5–24 h. The content of E2 in the medium was measured by ELISA. The data were represented as the mean ± SEM (n = 4). Different lowercase above columns indicates statistical significance (P < 0.05).
Reprinted from Molecular and Cellular Endocrinology, 527, Zhou, H., Chen, A., Lu, W., Corticotropin-releasing hormone reduces basal estradiol production in zebrafish follicular cells, 111222, Copyright (2021) with permission from Elsevier. Full text @ Mol. Cell. Endocrinol.