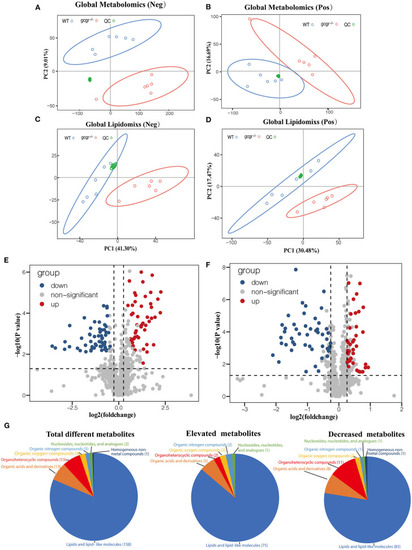
Profile of global metabolomics and lipidomics data. (A–D) Principal component analysis (PCA) of metabolomics (A,B) and lipidomics (C,D) profile of wild-type (WT) and gcgr−/− were indicated by different color circles. PCA scores were plotted in both positive mode (A,C) and negative mode (B,D). (E,F) Volcano plots of all identified metabolites from metabolomics (E) and lipidomics (F) analysis. The x-axis indicates Log2 (fold change) while the y-axis indicates -Log10 (P-value). Every single metabolite is represented as a dot. Different colors were used to represent down-regulated (blue), up-regulated (red), or non-significant (gray) metabolites. (G) Pie charts showing different classes of total different, elevated, and decreased metabolites. Different colors indicate different classes.

Pathway analysis of different metabolites. (A) Histogram of the holistic matching. All different metabolites are enriched into seven categories. The left blue bar indicates the number of enriched pathways. The right red bar indicates the number of covered metabolites. (B) Bar chart showing the number of metabolites covered by each enriched pathway. The y-axis indicates the number of metabolites while the x-axis indicates the pathway name. Red: increased; blue: decreased. The class of each pathway was labeled by the color bar on the top. (C) The network of enriched pathways. Each pathway is represented by a dot. Red: the ratio of the up-regulated metabolites is higher than down-regulated metabolites; blue: the ratio of down-regulated metabolites is higher than up-regulated metabolites. The dot size indicates the number of metabolites in the corresponding pathway. The line thickness represents the amount of substances shared by the linked pathways; the coarser, the more metabolites.

GCGR knockout induced glycerophospholipid metabolism dysregulation. (A) Disturbed glycerophospholipid metabolism. Dots represent metabolites, and blocks represent transcripts-encoded enzymes. Red: up-regulated, blue: down-regulated; or green: set substrates mixed with both up-regulated and down-regulated metabolites. The left displayed the heatmap enriched fatty acids. (B) Heatmap of corresponding glycerophospholipid metabolite sets. Z score normalized ionic strength for each metabolite was represented by different colors: high (red), low (blue), or average (white). The class of each pathway was marked by the color bar on the top.

GCGR knockout influenced arachidonic acid metabolism. Disturbed arachidonic acid metabolism. Dots represent metabolites, and blocks represent transcripts-encode enzymes. Red: up-regulated, blue: down-regulated; or green: set substrates mixed with both up-regulated and down-regulated metabolites.

GCGR knockout influenced cholesterol metabolism. Dots represent metabolites, and blocks represent transcripts-encode enzymes. Red: up-regulated, blue: down-regulated; or green: set substrates mixed with both up-regulated and down-regulated metabolites. The heatmap indicates altered bile acids. Z score normalized ionic strength for each metabolite was represented by different colors: high (red), low (blue), or average (white).

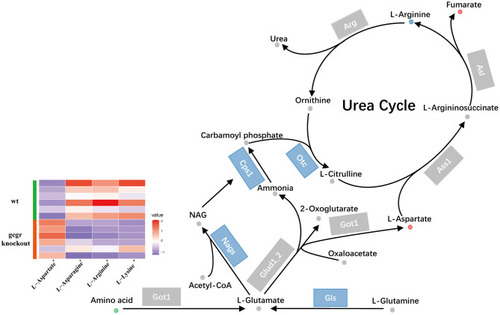
GCGR knockout influenced ureagenesis. Dots represent metabolites, and blocks represent transcripts-encode enzymes. Red: up-regulated, blue: down-regulated; or green: set substrates mixed with both up-regulated and down-regulated metabolites. The heatmap indicates altered amino acids. Z score normalized ionic strength for each metabolite was represented by different colors: high (red), low (blue), or average (white).

GCGR knockout influenced the tryptophan metabolism and locomotor activity in zebrafish. (A) Disturbed tryptophan metabolism. Dots represent metabolites, and blocks represent transcripts-encode enzymes. Red: up-regulated blue: down-regulated; gray: unvaried substrates. (B) Experimental validation of the melatonin level. (C) Locomotor activities were monitored in gcgr−/− mutants and WT zebrafish larvae under LD condition. (D,E)gcgr−/− mutants showed higher average moving distances at day (D) and night (E) than WT zebrafish larvae. Student t-test was conducted. *P < 0.05, **P < 0.01, ***P < 0.001.

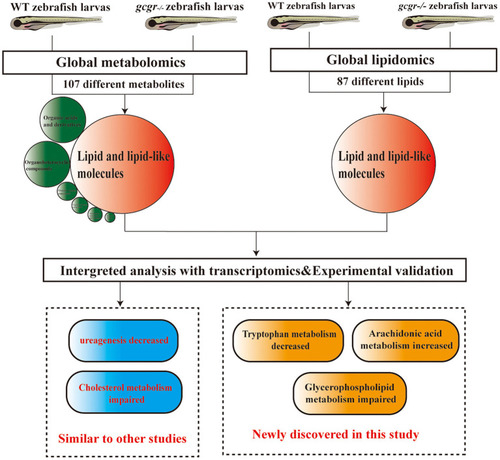
Summary of the experimental workflow and findings. Global metabolomics and lipidomics analysis were performed to study the metabolic change of gcgr−/− mutant zebrafish. One hundred seven significantly different metabolites were found by metabolomics, and most of these metabolites were lipid and lipid-like molecules. Eighty-seven significantly different lipids were found by lipidomics. Integration analyses of metabolomics, lipidomics, and transcriptomics were then performed. Based on the analysis, we found that gcgr−/− zebrafish displayed some similar metabolic changes to other studies. Importantly, we found that knockout of GCGR in zebrafish resulted in down-regulated tryptophan metabolism, up-regulated arachidonic acid metabolism, and disruption of glycerophospholipid metabolism.

Acknowledgments
This image is the copyrighted work of the attributed author or publisher, and ZFIN has permission only to display this image to its users. Additional permissions should be obtained from the applicable author or publisher of the image. Full text @ Front Cell Dev Biol