
- Title
-
Ythdf m6A Readers Function Redundantly during Zebrafish Development
- Authors
- Kontur, C., Jeong, M., Cifuentes, D., Giraldez, A.J.
- Source
- Full text @ Cell Rep.
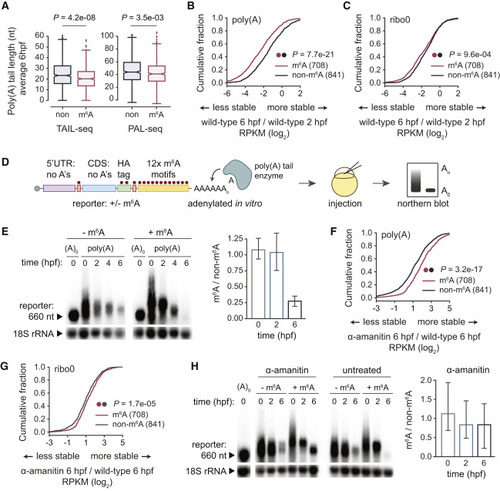
Figure 1. m6A Methylation Promotes Deadenylation of Maternal mRNAs (A) Average poly(A) tail lengths at 6 hpf for m6A-modified (m6A, n = 675) and non-modified (non, n = 841) maternal mRNAs from TAIL-seq and PAL-seq datasets. Box, first to last quartiles; whiskers, 1.5× interquartile range; center line, median; diamonds, outliers. (B and C) Cumulative distributions of fold changes in maternal mRNA abundance (log2 RPKM) between 6 and 2 hpf in wild-type embryos, for m6A-modified (n = 708) and non-modified mRNAs (n = 841), from poly(A) (B) or ribo0 (C) mRNA-seq. (D) Schematic of methylated mRNA reporter assay. The mRNA reporter had a 5′ UTR and CDS without adenines, AUG start, and UAG stop codons, and 3′ UTR with 12× m6A motifs (GGACT). The reporter was in vitro transcribed with or without m6A-modified adenines and polyadenylated. Reporter mRNA was injected into embryos and mRNA levels and polyadenylation were visualized by Northern blots. (E) Northern blot of m6A-modified (+m6A) and unmodified (−m6A) reporter at various time points (hpf) in wild-type embryos. Loading control (18S rRNA, ~1,900 nt) on bottom. Ratio of m6A to non-m6A reporter abundance (18S rRNA normalized, mean ± SD, n = 5 independent replicates) on right. A0, reporter injected without poly(A) tail. (F and G) Cumulative distributions of fold changes in maternal mRNA abundance (log2 RPKM) between α-amanitin treated and wild-type at 6 hpf, for m6A-modified (n = 708) and non-modified mRNAs (n = 841), from poly(A) (F) or ribo0 (G) mRNA-seq. (H) Northern blot of m6A-modified (+m6A) and unmodified (−m6A) reporter at various time points (hpf) in α-amanitin and untreated embryos. Loading control (18S rRNA, ~1,900 nt) on bottom. Ratio of m6A to non-m6A reporter abundance (18S rRNA normalized, mean ± SD, n = 3 independent replicates) for α-amanitin on right. A0, reporter injected without poly(A) tail. p values (A–C, F–G) were computed by a Mann-Whitney U test. |
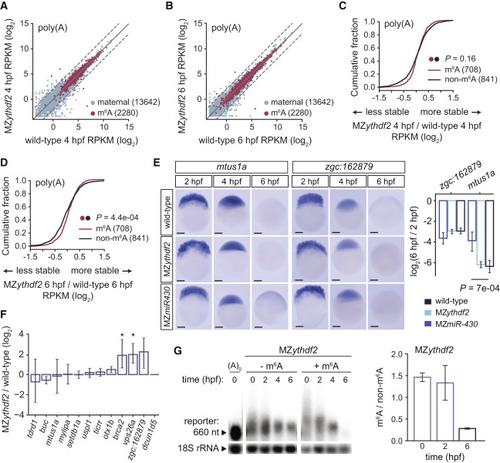
Figure 2. Ythdf2 Is Not Mandatory for Global Maternal Clearance but Marginally Contributes to m6A-Mediated Decay (A and B) Biplots of expression (log2 RPKM) of maternal (n = 13,642) and m6A-modified mRNAs (n = 2,280) between wild-type and MZythdf2 at 4 (A) or 6 (B) hpf, from poly(A) mRNA-seq. Dashed lines, 2-fold change. (C and D) Cumulative distributions of fold changes in maternal mRNA abundance (log2 RPKM) between MZythdf2 and wild-type at either 4 (C) or 6 (D) hpf, for m6A-modified (n = 708) and non-modified mRNAs (n = 841), from poly(A) mRNA-seq. p values computed by a Mann-Whitney U test. (E) In situs of methylated maternal mRNAs mtus1a and zgc:162879 in wild-type, MZythdf2, and MZmir-430 embryos at 2, 4, or 6 hpf. qRT-PCR mRNA abundance fold change (log2, 6 versus 2 hpf, mean ± SD, n = 3 independent replicates) on right. p values computed by a two-sided Student’s t test. Scale bars, 100 μM. (F) Methylated maternal mRNA abundance fold changes from qRT-PCR at 4 hpf between MZythdf2 and wild-type (mean ± SD, n = 3 independent replicates). Only brca2 (p = 5.4e−03) and vps26a (p = 6.3e−03) were significantly stabilized. (G) Northern blot of m6A-modified (+m6A) versus unmodified (−m6A) reporter at various time points (hpf) in MZythdf2 embryos. Loading control (18S rRNA, ~1,900 nt) on bottom. Ratio of m6A to non-m6A reporter abundance (18S rRNA normalized, mean ± SD, n = 2 independent replicates) on right. A0, reporter injected without poly(A) tail. For (A) –(F), wild-type label represents background-matched wild-type controls. |
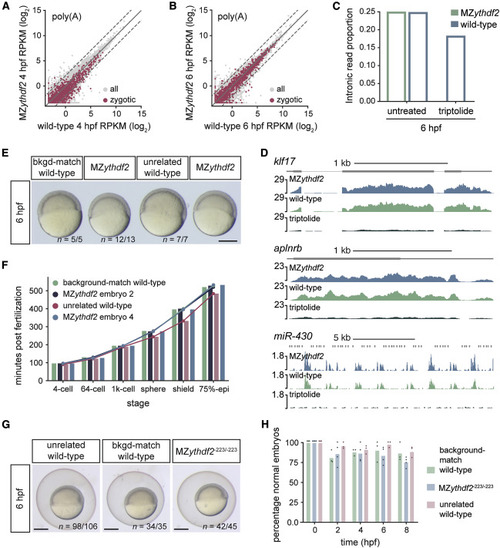
Figure 3. Loss of Ythdf2 Does Not Hinder Zygotic Genome Activation or Onset of Gastrulation (A and B) Biplots of expression of zygotic (n = 1,760) and all mRNAs (n = 20,119) between wild-type and MZythdf2 embryos at 4 (A) or 6 (B) hpf, from poly(A) mRNA-seq. Dashed lines, 2-fold change. (C) Proportion of intronic reads relative to total read number for wild-type, MZythdf2, and triptolide-treated embryos at 6 hpf from ribo0 mRNA-seq. (D) Genome tracks of zygotic transcripts in MZythdf2, wild-type, and triptolide-treated embryos from 6 hpf poly(A) mRNA-seq. Fold-changes (log2 RPKM) for aplnrb, klf17, and miR-430 were 0.04, −0.21, and −0.32, respectively, for MZythdf2 versus wild-type, and −2.67, −3.08, and −3.83, respectively, for triptolide versus wild-type. For (A)–(D), wild-type controls were background-matched wild-type embryos. (E) Image of zebrafish embryos where MZythdf2 and background-matched (bkgd-match) wild-type (see Figure S2A) exhibit similar developmental delay relative to unrelated wild-type at 6 hpf. Image is from time-lapse movie (Video S1). MZythdf2 embryos are from the same clutch. n, replicate number of embryos at same developmental stage. Scale bar, 500 μM. (F) Quantification of developmental rates of embryos in (E, Video S1). Bars and dots indicate minutes post fertilization at which embryos reach corresponding developmental stage. MZythdf2 embryos 2 and 4 correspond to the embryos second from left and on far right in (E), respectively. (G) Representative images of MZythdf2-223/-223, background-matched (bkgd-match) wild-type, and unrelated wild-type embryos at 6 hpf. n, replicate number of embryos at same developmental stage. Scale bars, 500 μM. (H) Quantification of normally developing embryos is similar for each genotype. Dots indicate quantifications from three independent clutches and bars show mean percentage of normally developed embryos at each time point (hpf) from all clutches. |
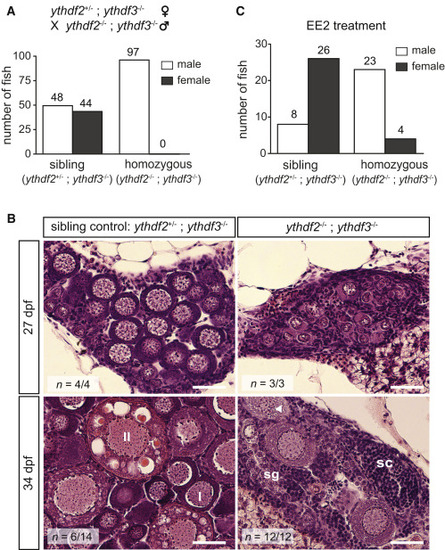
Figure 4. Ythdf2 and Ythdf3 Are Redundantly Required for Zebrafish Ovary Development (A) Numbers of male and female fish of each genotype. Sibling control and double ythdf2;ythdf3 homozygotes were offspring from the same cross, depicted on top. (B) Gonad histology of double homozygous (ythdf2−/−;ythdf3−/−) and sibling control fish from the cross in (A). At 27 dpf, mutants exhibit less developed juvenile ovaries than controls. At 35 dpf, 6 sibling fish had adult ovaries and 8 had testes, while all 12 ythdf2−/−;ythdf3−/− fish had testes. I, stage I oocytes; II, stage II oocytes; triangle, apoptotic oocyte; sg, spermatogonia; sc, spermatocytes. n, replicate number with similar gonads. Scale bars, 40 μm. (C) Numbers of male and female fish of each genotype, following treatment with 17α-ethynylestradiol (EE2). Fish were from the same cross as in (A). PHENOTYPE:
|
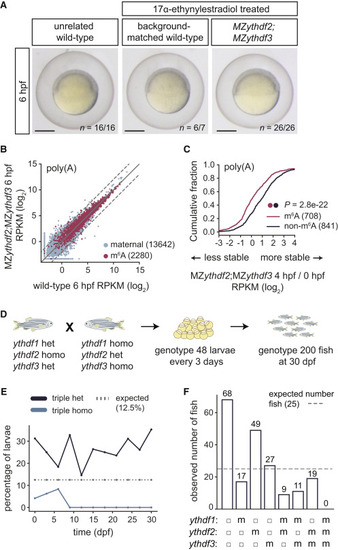
Figure 5. Triple Loss of Ythdf Readers Disrupts Zebrafish Development (A) MZythdf2;MZythdf3, background-matched wild-type, and unrelated TU-AB wild-type zebrafish embryos develop at similar rates. Parents of mutant and background-matched control embryos were 17α-ethynylestradiol treated. n, replicate number of embryos at same developmental stage. Scale bars, 500 μm. (B) Biplot of expression (log2 RPKM) of maternal (n = 13,642) and m6A-modified (n = 2,280) mRNAs between wild-type and MZythdf2;MZythdf3, from 6 hpf poly(A) mRNA-seq. Dashed lines, 2-fold change. (C) Cumulative distribution of fold changes in maternal mRNA abundance (log2 RPKM) between 4 and 0 hpf in MZythdf2;MZythdf3 embryos, for m6A-modified (n = 708) and non-modified (n = 841) mRNAs, from poly(A) mRNA-seq. p values computed by a Mann-Whitney U test. (D) Schematic of cross and genotyping strategy for triple Ythdf mutants. Female fish (ythdf1+/−;ythdf2−/−;ythdf3+/−) were crossed to males (ythdf1−/−;ythdf-+/−;ythdf3−/−) to generate triple homozygotes (1 of 8 possible genotypes). Every 3 days, 48 larvae were genotyped, with 200 more fish genotyped at 30 dpf. (E) Percentage of triple heterozygous (het) or triple homozygous (homo) fish during development. Dotted line, expected percentage (12.5%) of each genotype, from cross in (D). (F) Number of fish with each genotype from cross in (D) at 30 dpf. For each ythdf allele: filled circle, heterozygous; m, homozygous. Dotted line, expected fish number (25), equal for all genotypes. PHENOTYPE:
|
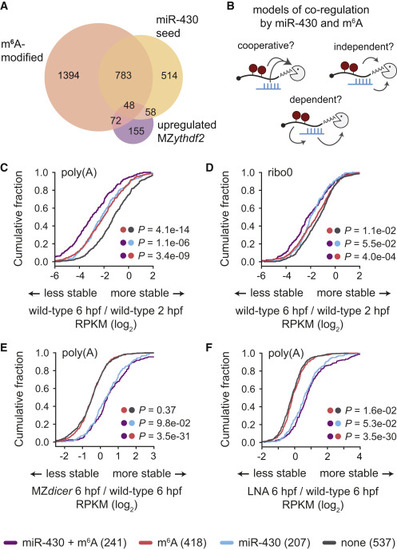
Figure 6. miR-430 and m6A Pathways Are Independent and Co-regulate Maternal mRNAs for Destabilization (A) Venn diagram of numbers of maternal mRNAs with a miR-430 seed in the 3′ UTR, are m6A modified, are stabilized in MZythdf2 (fold change > 0.5), or have overlapping features. (B) Schematic of potential mechanisms of miR-430 and m6A co-regulation, tested in (C)–(F). The pathways could function cooperatively, enhancing decay of common targets, independently, acting additively on common targets, or m6A could be dependent on miR-430, causing disruption of m6A-based mRNA decay upon loss of miR-430. (C–F) Cumulative distributions of fold changes in maternal mRNA abundance (log2 RPKM) for transcripts that are targets of both m6A and miR-430 (miR-430 + m6A, n = 241), m6A only (m6A, n = 418), miR-430 only (miR-430, n = 207), or neither (none, n = 537) from poly(A) (C, E, F) or ribo0 (D) mRNA-seq. Fold-change comparisons were between 6 and 2 hpf in wild-type (C, D) or at 6 hpf between MZdicer (E) or LNA-treated (F) embryos and wild-type controls. Dots indicate groups compared for corresponding p values, computed by a Mann-Whitney U test. Legend on bottom. |