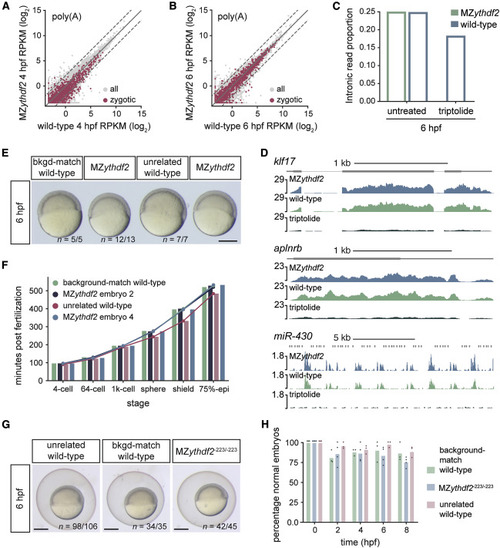
Figure 3. Loss of Ythdf2 Does Not Hinder Zygotic Genome Activation or Onset of Gastrulation (A and B) Biplots of expression of zygotic (n = 1,760) and all mRNAs (n = 20,119) between wild-type and MZythdf2 embryos at 4 (A) or 6 (B) hpf, from poly(A) mRNA-seq. Dashed lines, 2-fold change. (C) Proportion of intronic reads relative to total read number for wild-type, MZythdf2, and triptolide-treated embryos at 6 hpf from ribo0 mRNA-seq. (D) Genome tracks of zygotic transcripts in MZythdf2, wild-type, and triptolide-treated embryos from 6 hpf poly(A) mRNA-seq. Fold-changes (log2 RPKM) for aplnrb, klf17, and miR-430 were 0.04, −0.21, and −0.32, respectively, for MZythdf2 versus wild-type, and −2.67, −3.08, and −3.83, respectively, for triptolide versus wild-type. For (A)–(D), wild-type controls were background-matched wild-type embryos. (E) Image of zebrafish embryos where MZythdf2 and background-matched (bkgd-match) wild-type (see Figure S2A) exhibit similar developmental delay relative to unrelated wild-type at 6 hpf. Image is from time-lapse movie (Video S1). MZythdf2 embryos are from the same clutch. n, replicate number of embryos at same developmental stage. Scale bar, 500 μM. (F) Quantification of developmental rates of embryos in (E, Video S1). Bars and dots indicate minutes post fertilization at which embryos reach corresponding developmental stage. MZythdf2 embryos 2 and 4 correspond to the embryos second from left and on far right in (E), respectively. (G) Representative images of MZythdf2-223/-223, background-matched (bkgd-match) wild-type, and unrelated wild-type embryos at 6 hpf. n, replicate number of embryos at same developmental stage. Scale bars, 500 μM. (H) Quantification of normally developing embryos is similar for each genotype. Dots indicate quantifications from three independent clutches and bars show mean percentage of normally developed embryos at each time point (hpf) from all clutches.
|
