
- Title
-
Regulation of Gluconeogenesis by Aldo-keto-reductase 1a1b in Zebrafish
- Authors
- Li, X., Schmöhl, F., Qi, H., Bennewitz, K., Tabler, C.T., Poschet, G., Hell, R., Volk, N., Poth, T., Hausser, I., Morgenstern, J., Fleming, T., Nawroth, P.P., Kroll, J.
- Source
- Full text @ iScience

Figure 1 Expression of akr1a1b in Zebrafish Development and in Adult Organs (A and B) (A) Akr1a1b is ubiquitously expressed in zebrafish development (relatively compared with 24 hpf, n = 4, mean ± SD) and (B) in all analyzed organs of adult zebrafish (relatively compared with heart, n = 5, mean ± SD). (C) In adult zebrafish kidney, immunohistochemistry revealed high Akr1a1b expression in renal tubules (arrows). Box shows kidney immunostaining with secondary antibody only. Expression of genes in (A and B) was determined by RT-qPCR and normalized to β-actin. ∗∗∗p < 0.001, p value was calculated by one-way ANOVA. Scale bars, 50 μm. |

Figure 2Generation and Validation of akr1a1b-/- Zebrafish Mutants (A) CRISPR-Cas9 technology was used to establish akr1a1b knockout zebrafish. Schematic depiction of wild-type akr1a1b target sequence and two identified frameshift mutations and their corresponding chromatograms including a 17-bp insertion (Δ+17) in the Tg(wt1b:EGFP) reporter line and a 23-bp deletion (Δ-23) in the Tg(fli1:EGFP) reporter line. Red dashed boxes indicate start of genomic alterations. (B) Western blot for Akr1a1b expression in zebrafish livers showed absence of Akr1a1b protein in the 17-bp insertion (Δ+17) and in the 23-bp deletion mutant (Δ-23), respectively, which validates the akr1a1b knockout zebrafish model. Beta-actin served as loading control. (C) Δ+17 akr1a1b-/- zebrafish larvae at 96 hpf showed a strong descend of Akr enzyme activity (n = 3 clutches with 50 larvae, mean ± SD). (D) Δ+17/Δ-23 akr1a1b-/- larvae at 96 hpf have increased MG concentrations (n = 9 clutches with 50 larvae). ∗p < 0.05, ∗∗∗p < 0.001, p value was calculated by t test. |
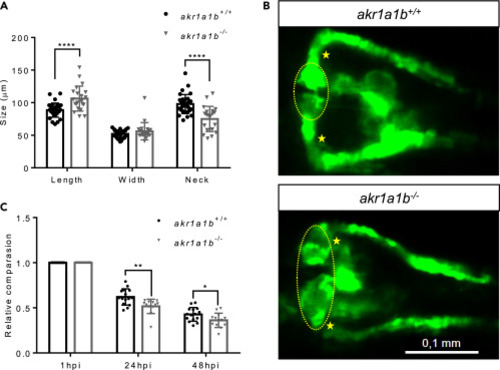
Figure 3Akr1a1b Knockout in Zebrafish Caused Alterations of the Embryonic Pronephros (A) Compared with akr1a1b+/+ embryos (n = 33, mean ± SD) at 48 hpf, Δ+17 akr1a1b-/- mutants (n = 21, mean ± SD) displayed an enlarged glomerulus (encircled) and shortened tubular neck (asterisk). (B) Representative pronephros images of 48hpf old akr1a1b+/+ and Δ+17 akr1a1b-/- embryos. (C) A significant increased loss of fluorescence in Δ+17akr1a1b-/- mutants (n = 18, mean ± SD) was observed when compared with akr1a1b+/+ larvae (n = 21, mean ± SD), which indicated an altered glomerular filtration rate in akr1a1b-/- mutants. ∗p < 0.05, ∗∗p < 0.01, ∗∗∗∗p < 0.0001, p value was calculated by t test. Scale bar: 0.1 mm. |
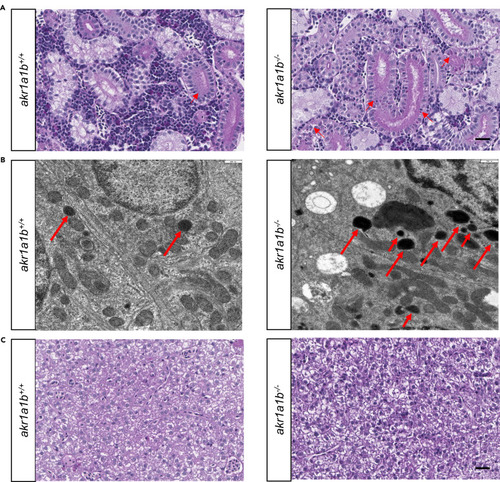
Figure 4Akr1a1b Knockout Altered Adult Zebrafish Kidneys, but Livers Remained Normal (A) Periodic acid-Schiff (PAS) staining and (B) electron microscopy (EM) showed deposition of diastase-resistant PAS-positive hyaline droplets, putatively lysosomes (red arrows), within the epithelium of proximal tubules in Δ-23 akr1a1b-/- kidneys. Akr1a1b+/+ kidneys only have scattered small droplets. Quantification of 19 akr1a1b-/- EM images revealed 9 images with “+” and 10 images with “++” PAS-positive hyaline droplets. All 20 akr1a1b+/+ EM images were scored as “0.” (C) Adult Δ-23 akr1a1b-/- livers stained by PAS were unaltered. Scale bars: 20 μm in (A and C) and 500 nm (B). PHENOTYPE:
|
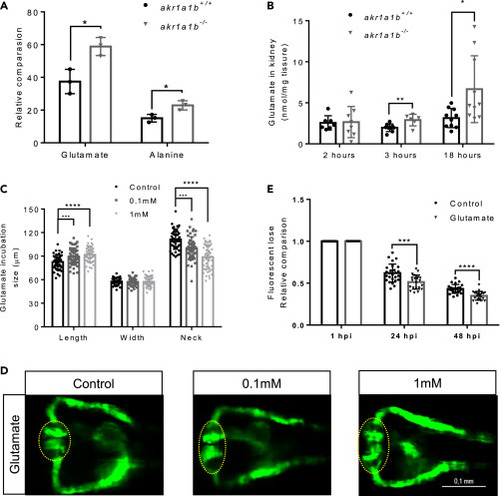
Figure 5Glutamate Accumulation in akr1a1b-/- Mutants Damaged the Kidneys (A) Primary metabolites were measured in 96-hpf larvae by gas chromatography-mass spectrometry analysis and showed a significant increase for glutamate and alanine in Δ+17 akr1a1b-/- larvae (n = 3 clutches with 50 larvae, mean ± SD). (B) Glutamate accumulated in adult Δ+17/Δ-23 akr1a1b-/- zebrafish kidneys at 3 and 18 h postprandial (2 h postprandial: n = 7 in akr1a1b+/+, n = 8 in akr1a1b-/-; 3 h postprandial: n = 9 in akr1a1b+/+, n = 6 in akr1a1b-/-; 18 h postprandial: n = 10 in both groups, mean ± SD). (C) Enlarged glomerulus and shortened tubular neck length in 48-hpf wild-type zebrafish embryos treated with glutamate (n = 46 in control group; n = 50 in 0.1 mM group; n = 49 in 1 mM group, mean ± SD). (D) Representative pronephros images of glutamate treated 48hpf embryos. Glomeruli are encircled. (E) A significant increased loss of fluorescence in 1 mM glutamate-treated wild-type larvae both at 24 and 48 hpi (n = 26 in control group; n = 21 in 1 mM group, mean ± SD). ∗p < 0.05, ∗∗p < 0.01, ∗∗∗p < 0.001, ∗∗∗∗p < 0.0001; p value in (A, B, and E) was calculated by t test, p value in (C) was calculated by one-way ANOVA, Scale bar, 0.1 mm. |
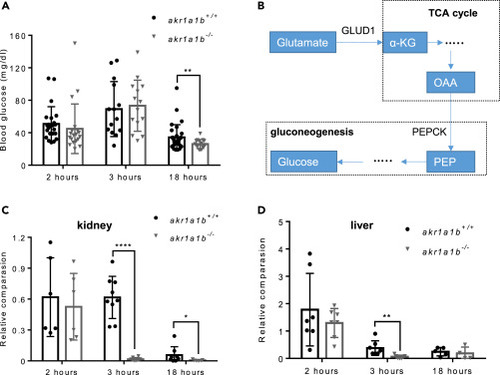
Figure 6Inhibition of Gluconeogenesis Led to Hypoglycemia in Overnight Fasted akr1a1b-/-Zebrafish (A) Blood glucose was measured at different time points after feeding in adult akr1a1b+/+ and Δ+17/Δ-23 akr1a1b-/- zebrafish and found hypoglycemia after overnight fasting in akr1a1b-/- zebrafish (2 h postprandial: n = 23 in akr1a1b+/+, n = 20 in akr1a1b-/-; 3 h postprandial: n = 14 in akr1a1b+/+, n = 14 in akr1a1b-/-; 18 h postprandial: n = 31 in akr1a1b+/+, n = 16 in akr1a1b-/-, mean ± SD). (B) Schematic depiction of gluconeogenesis and how glucogenic amino acid glutamate serves as substrate. PEPCK: phosphoenolpyruvate carboxykinase; PEP: phosphoenolpyruvate; OAA: oxaloacetate; α-KG: α-ketoglutarate; GLUD1: glutamate dehydrogenase 1. (C) Loss of cytosolic cPEPCK expression in adult Δ+17/Δ-23 akr1a1b-/- kidneys 3 and 18 h after feeding (2 h postprandial: n = 6 in akr1a1b+/+, n = 6 in akr1a1b-/-; 3 h postprandial: n = 9 in akr1a1b+/+, n = 8 in akr1a1b-/-; 18 h postprandial: n = 8 in akr1a1b+/+, n = 7 in akr1a1b-/-, mean ± SD). (D) Loss of cytosolic cPEPCK expression in adult Δ+17/Δ-23 akr1a1b-/- livers 3 h after feeding (2 h postprandial: n = 7 in akr1a1b+/+, n = 7 in akr1a1b-/-; 3 h postprandial: n = 7 in akr1a1b+/+, n = 7 in akr1a1b-/-; 18 h postprandial: n = 5 in akr1a1b+/+, n = 4 in akr1a1b-/-, mean ± SD). cPEPCK expression was analyzed by RT-qPCR and normalized to b2m. ∗p < 0.05, ∗∗p < 0.01, ∗∗∗∗p < 0.0001, p value was calculated by t test. |

Figure 7NO-Dependent S-Nitrosylation Regulated Gluconeogenesis and Pronephros Development in akr1a1b−/− Mutants (A) Nitrotyrosine was measured by ultrahigh-performance liquid chromatography-mass spectrometry, and was increased in 96-hpf Δ-23 akr1a1b-/- larvae (n = 3 clutches with 50 larvae, mean ± SD). (B) Western blots show increased S-nitrosylated proteins (SNOs) in adult Δ-23 akr1a1b-/- kidneys (n = 2). (C) Inhibition of NO-dependent S-nitrosylation by L-NAME in Δ+17 akr1a1b-/- zebrafish 48-hpf embryos rescued the altered pronephros (n = 27 in akr1a1b+/+ group; n = 27 in akr1a1b+/+ & L-NAME group; n = 34 in akr1a1b-/- group; n = 25 in akr1a1b-/- & L-NAME group, mean ± SD). (D) Representative pronephros images of 48hpf akr1a1b+/+ and Δ+17 akr1a1b-/- embryos treated with L-NAME. Glomeruli are encircled. (E) cPEPCK expression was regulated by S-nitrosylation. Inhibition of S-nitrosylation by L-NAME treatment increased cPEPCK expression in akr1a1b+/+ and Δ-23 akr1a1b-/- encircled larvae at 96 hpf and normalized cPEPCK expression in akr1a1b-/- encircled larvae as measured by RT-qPCR (n = 10 in all groups, mean ± SD). ∗p < 0.05, ∗∗∗p < 0.001, ∗∗∗∗p < 0.0001, p value in (A) was calculated by t test, p values of (C and E) were calculated by one-way ANOVA. Scale bar, 0.1 mm. |