
- Title
-
An Embryonic Zebrafish Model to Screen Disruption of Gut-Vascular Barrier upon Exposure to Ambient Ultrafine Particles
- Authors
- Baek, K.I., Qian, Y., Chang, C.C., O'Donnell, R., Soleimanian, E., Sioutas, C., Li, R., Hsiai, T.K.
- Source
- Full text @ Toxics
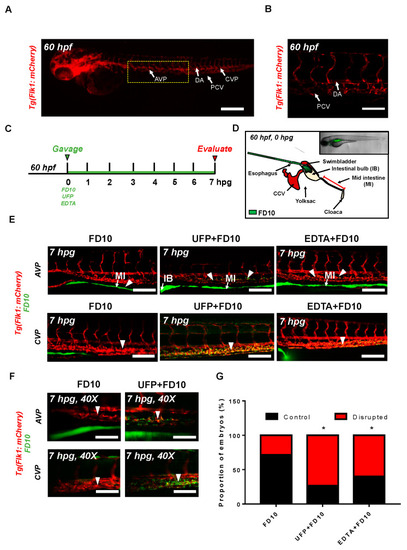
Acute ultrafine particulate matter (UFP) ingestion disrupts intestinal epithelial barrier integrity. Transgenic Tg(flk1: mCherry) zebrafish embryos at 60 hpf were micro-gavaged with FITC-conjugated dextran (FD10, 10 kDa). (A,B) Anatomy of endothelial vasculature in the Tg(flk1: mCherry) embryo. DA: dorsal aorta; PCV: posterior caudal vein; AVP: anterior venous capillary plexus; CVP: caudal vein capillary plexus; Scale bar: 32 μm. (C) Experimental design: At 2 dpf, embryos were randomly chosen for micro-gavage with FD10 solution with or without UFP or EDTA at 20 mM. Intestinal barrier integrity and translocation of FD10 to vascular endolumen (flk1+) were evaluated at 7 h post gavage (hpg). (D) A schematic representation of micro-gavage in an embryonic gastrointestinal (GI) tract. FD10 solution was micro-gavaged in the intestinal bulb without disrupting the esophagus, swim bladder and yolk sac. (E) Representative images of the AVP and CVP at 7 hpg. In FD10 gavaged-controls, FD10 remained only in the intestinal bulb and mid-intestine. In contrast, co-gavaging FD10 with UFP or ethylenediaminetetraacetic acid (EDTA) accumulated FD10 in the AVP and CVP (white arrow heads). Scale bar: 20 μm. (F) Magnified view of the AVP and CVP. Scale bar: 20 μm. (G) Percentage of embryos exhibiting endoluminal FD10 fluorescence (* p < 0.05 vs. FD10, n = 10 per group). |
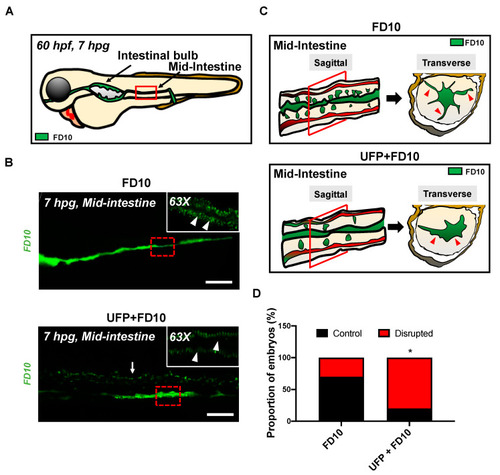
Acute UFP exposure disrupts maturation of embryonic GI tract. (A) Schematic representation of the embryonic GI tract at 7 hpg. The density of FD10 fluorescence in the mid-intestine was assessed to evaluate maturation of the GI tract (Red box). (B) Representative images of UFP-disrupted GI tract (white dashed box). Compared to FD10-gavaged controls, co-gavaging UFP, as denoted with endoluminal FD10 fluorescence (white arrow), altered morphology and systemically reduced the density of FD10 fluorescence in the mid-intestine (white arrowheads, n = 5 per group). Scale bar: 20 μm. (C) Schematic representations of sagittal and transverse views of the mid-intestine with and without UFP gavage. Acute UFP exposure in developing GI system retards maturation (red arrowheads). (D) Percentage of embryos exhibiting reduced FD10 density in the mid intestine (* p < 0.05 vs. FD10, n = 10 per group). |
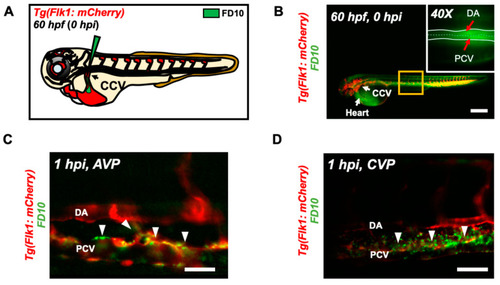
Micro-angiography via common cardinal vein (CCV) to mimic UFP gavage. (A) A schematic representation of micro-angiography via CCV to introduce FD10 to the microcirculatory system. (B) A representative image of the transgenic Tg(flk1: mCherry) embryo following FD10 injection to CCV. At 0 hpi, FD10 fluorescence was prominent at the injection site, CCV, heart, DA and PCV. Scale bar: 100 μm. (C,D) At 1 hpi, FD10 was distributed in the AVP and CVP, between the DA and PCV, mimicking UFP gavage-mediated effects (white arrowheads, n = 5 per group). Scale bar: 32 μm. |
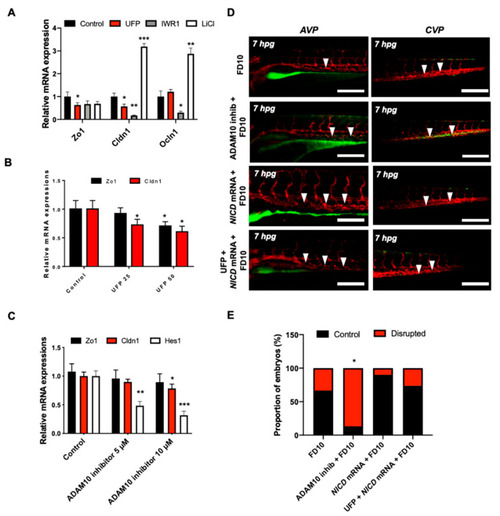
UFP exposure down-regulates mRNA expressions of endothelial tight junction (TJ) protein and the Notch target gene to disrupt the GVB. mRNA expressions of TJ proteins, including zonula occludens1 (Zo1), claudin 1 (Cldn1), and occludin 1 (Ocln1), and the Notch target genes, including Hairy and enhancer of split-1 (Hes1), were assessed in vitro by cultured human aortic endothelial cells (HAEC). (A) UFP exposure (25 μg·mL−1 for 6 h) inhibited Zo1 and Cldn1 mRNA expressions, whereas Ocln1 mRNA remained unchanged. While Iwr1 treatment (10 μM) diminished overall TJ mRNA expression, LiCl (20 mM) up-regulated Cldn1 and Ocln1 mRNA expression (* p < 0.05 vs. DMSO for Iwr1, H2O for LiCl, n = 3, ** p < 0.01, *** p < 0.001). (B) UFP exposure (25–50 μg·mL−1 for 6 h) down-regulated both TJ (Zo1 and Cldn1 mRNA) and Notch target genes (Hes1) mRNA expression in a dose-dependent manner ( |
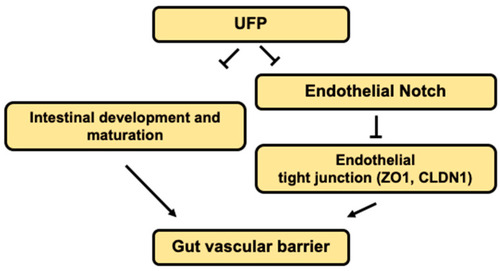
Schematic overviews of the proposed mechanisms. |