FIGURE SUMMARY
Title

Kisspeptin-1 regulates forebrain dopaminergic neurons in the zebrafish

Authors
Abdul Satar, N.M., Ogawa, S., Parhar, I.S.
Source
Full text @ Sci. Rep.

Effect of Kiss1 treatment on expression of dopamine-related genes. (A,B) Schematic drawings of horizontal (A) and sagittal (B) views of a zebrafish brain illustrating intracranial administration of Kiss1 solution. An incision is made into the skull over the anterior part of the left optic tectum using a sterilized barbed-end needle (A). Through the incision made, Kiss1 solution was administered nearby Kiss1 neurons in the ventral habenula (vHb) using a heat-pulled glass capillary micropipette (B). T telencephalon, H habenula, IPN interpeduncular nucleus, MR median raphe. Adopted from Ogawa et al. and Lim et al.11,70. (CE) Expression levels of th1 (C), th2 (D) and dat (E) mRNAs were measured in the whole brain (n = 7) at 30-min, 1-h, 3-h, 6-h, and 24-h following the intracranial administration with either vehicle (control; distilled water) or Kiss1 (K1) or its paralogous peptide, Kiss2 (K2) at doses of 10–12 or 10–9 mol/ fish. Data are representative of mRNA expression in relative to eef1a1l1 housekeeping gene and presented mean ± SEM as fold-change. *P < 0.05; ***P < 0.0001 versus control group using 2-way ANOVA followed by Dunnett’s multiple comparison test.

Effect of Kiss1 on the expression of dopamine-related genes in different brain regions. (A) Schematic sagittal view of a zebrafish brain illustrating the macro-dissected brain regions that were subjected to analyses of gene-expression levels. Blue-shaded regions indicate the distribution of dopaminergic cell populations. (BD) Relative expression (fold-change) of th1 (B), th2 (C) and dat (D) mRNAs (n = 10 fish/group) in macro-dissected brain regions 24-h after central administration of either vehicle (control; distilled water) or Kiss1 (K1) with doses of 10–12 or 10–9 mol/ fish. Data presented as mean ± SD. *P < 0.05; ***P < 0.0001 using two-way ANOVA, Tukey's multiple comparisons test.

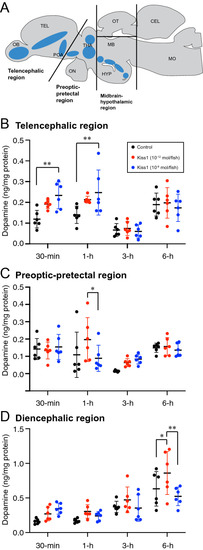
Effect of Kiss1 on dopamine levels in different brain regions. (A) Schematic sagittal view of a zebrafish brain illustrating the macro-dissected brain regions that were subjected to analyses of dopamine content levels and the distribution of dopaminergic cell populations (blue-shaded zones). (BD) Dopamine content levels (ng per mg protein; n = 6 fish/group) in macro-dissected telencephalon (B), preoptic-pretectal (C) and midbrain-hypothalamic (D) regions, 30-min, 1-h, 3-h and 6-h after central administration of either vehicle (control; distilled water) or Kiss1 with doses of 10–12 or 10–9 mol/ fish. Data presented as mean ± SD. *P < 0.05; **P < 0.01 using 2-way ANOVA followed by Tukey’s multiple comparison test.

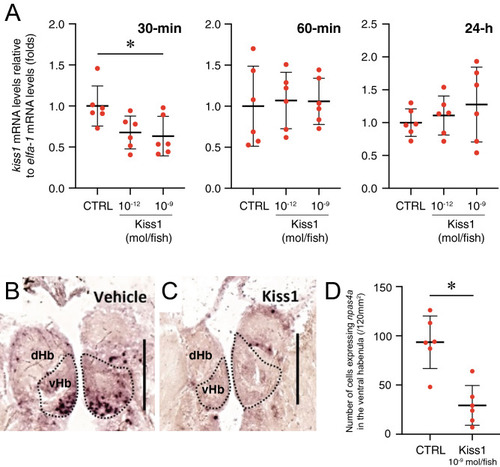
Effect of Kiss1 on the habenula activity. (A) Central administration of Kiss1 (10–9 mol/fish) significantly suppressed expression of kiss1 mRNA levels (against the eef1a1l1 in fold-change ± SD, n = 6 fish/ group) 30-min, but not 1-h and 24-h after administration. (B,C) Expression of npas4a in the vHb 30-min after the administration of vehicle (control, B) or Kiss1 (10–9 mol/fish, C). Scale bars 100 µm. (D) Number of cells expressing npas4a in the habenula were significantly lower as compared to control fish. *P < 0.05 vs. controls using one-way ANOVA followed by Dunnett’s multiple comparison test (kiss1) or unpaired t-test (npas4a).

Expression of npas4a gene in the brain of transgenic dat:EGFP fish followed by 30-min post Kiss1 administration. (a) Schematic sagittal view of a zebrafish brain illustrating the distribution of dopaminergic cell population (blue-shaded zones) in the brain of zebrafish. Boxes with red indicate the boundaries of the photomicrographic illustrations in below (be). (be) EGFP (green)-labelled dopaminergic neurons in the olfactory bulb (OB, b); dorsal nucleus of ventral telencephalic area (Vd, c); anterior part of the parvocellular preoptic nucleus (PPa, d) and in the anterior thalamic nucleus (A, e) above the fasciculus retroflexus (FR). Although cells expressing npas4a mRNA (magenta) were seen in several brain regions (b'e'), there was no expression of npas4a in dopaminergic cells (b"e"). Scale bars 20 µm.

Neural tracer application into the median raphe. (af) Mid-sagittal visualization of mCherry (magenta)-labelled Kiss1 efferent projection from the ventral habenula (vHb, b) through the fasciculus retroflexus (FR) towards the median raphe (MR, c) in the brain of Tg(kiss1:mCherry) zebrafish without neural tracer implantation (df). (gi) A thin-strip of the nylon membrane-coated with NeuroVue tracer (NeuroVue Maroon, green) was selectively inserted into the MR (h,i). (jl) Photomicrograph of mid-sagittal visualization of tracer-labelled neural tracks (arrow heads) from the MR (g) towards the vHb (j). Scale bars (a,d) 500 μm; (b,c,e,f,jl) 20 μm; (g) 200 μm; (h,i) 50 μm.

Tracer-labelled neuronal projection from the median raphe. (A,A’) Schematic sagittal view of the zebrafish brain illustrating the application sites of the neural tracer: the median raphe (MR, A) and interpeduncular nucleus (IPN, A’). (B) A schematic horizontal view of the zebrafish brain illustrating levels at which sagittal sections (cf and c’f’) were taken. (cf) Photomicrograph of mid-sagittal visualization of tracer (NeuroVue Maroon, green)-labelled neural fibers/tracks (arrow heads) from the MR. Tracer-labelled fibers/tracks were seen in the mesencephalon including the fasciculus retroflexus (FR, e), and in the rhombencephalon (ef). Tracer-labelled tracks were seen from the diencephalon towards the medio-dorsal region of the telencephalon which is the medial forebrain bundle (MFB, e,f). In addition, some fibers were also seen in the cerebellum (e,f). (c’f’) In the brain where the tracer was applied to the IPN (e’f’), tracer-labelled fibers/tracks were mainly seen in the dorsal region of the mesencephalon including the FR, and in the rhombencephalon and medulla spinal regions. In the rhombencephalon, fibers were seen in the griseum centrale (GC, e’). In addition, thick fibers were also seen in the cerebellum (c’f’). Scale bars 500 μm.

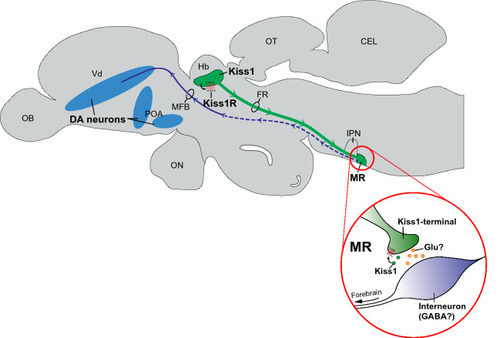
Schematic drawing illustrating putative connection from the habenula Kiss1 towards telencephalic dopaminergic neurons in the brain of zebrafish. Habenula Kiss1 neurons send projection and terminate at the median raphe (MR) through the fasciculus retroflexus (FR). Habenula Kiss1 neuronal activity is controlled by autocrine feedback of Kiss1 via co-expressing Kiss1R. At the MR, inhibition of Kiss1 neurons may influence on postsynaptic glutamatergic (Glu) transmission on interneurons such as GABAergic neurons (in red circle). Neurons receive Kiss1 inputs within the MR further send projections towards the telencephalon via the medial forebrain bundle (MFB) and possibly act on the telencephalic dopaminergic (DA) cells. OB olfactory bulb, Vd ventral telencephalon, POA preoptic area, ON optic nerve, Hb habenula, OT optic tectum, CEL cerebellum, IPN interpeduncular nucleus.

Acknowledgments
This image is the copyrighted work of the attributed author or publisher, and ZFIN has permission only to display this image to its users. Additional permissions should be obtained from the applicable author or publisher of the image. Full text @ Sci. Rep.