
- Title
-
Schistosoma mansoni Eggs Modulate the Timing of Granuloma Formation to Promote Transmission
- Authors
- Takaki, K.K., Rinaldi, G., Berriman, M., Pagán, A.J., Ramakrishnan, L.
- Source
- Full text @ Cell Host Microbe
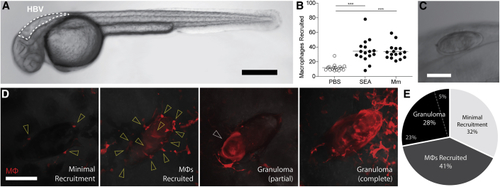
Macrophage Responses to SEA and (A) Zebrafish larvae at 30 h post fertilization (hpf) with hindbrain ventricle (HBV) outlined. Scale bar, 300 μm. (B) Mean macrophage recruitment to HBV 3 h post-injection with phosphate-buffered saline (PBS), SEA, or (C) (D) Representative images of macrophage responses to (E) Prevalence of macrophage responses to implanted eggs as defined in (D), representing 8 experiments, each constituting a separate batch of eggs and a separate clutch of zebrafish larvae, as detailed in |
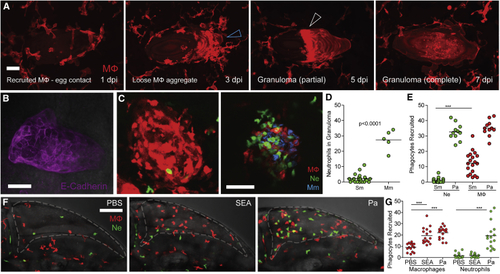
(A) Time-lapse microscopy of egg monitored at 2-day intervals from 1–7 dpi showing in the four panels, respectively, sequential macrophage recruitment, aggregation (blue arrowhead), formation of the partial granuloma (white arrowhead), and its expansion to encase the egg. Scale bar, 25 μm. (B) Epithelioid granuloma immunostained using E-cadherin antibody. Scale bar, 50 μm. (C) Confocal images of granulomas in representative transgenic zebrafish larvae with red-fluorescent macrophages (MΦ) and green-fluorescent neutrophils (Ne) at 5 dpi with (D) Quantification of neutrophils recruited to Sm and Mm granulomas. (E) Quantification of phagocytes recruited to Sm and (F) Confocal images of HBV of representative larvae showing phagocyte recruitment at 6 h post-injection with phosphate buffered saline (PBS) (left), (G) Quantification of phagocytes recruited to Sm and |
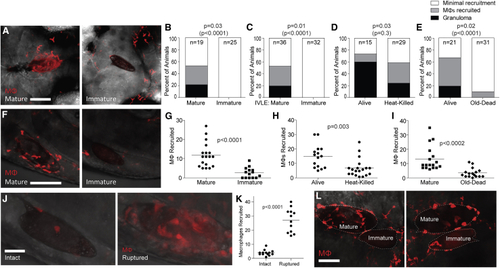
Immature Eggs Do Not Induce Macrophage Recruitment or Granuloma Formation (A–E) Granuloma formation and macrophage recruitment at 5 dpi comparing mature eggs with (A and B) immature eggs, (C) immature (B–E) Percent of animals with different levels of macrophage recruitment to the egg. (F–I) Macrophages recruited to mature eggs at 3 hpi compared with (F and G) immature eggs, (H) heat-killed eggs, and (I) old dead eggs. Representative images in (F), scale bar, 100 μm. (G–I) Quantification of macrophages recruited. (J) Confocal images showing macrophage recruitment to intact and mechanically ruptured immature eggs 6 hpi. Scale bar, 25 μm. (K) Quantification of macrophage recruitment to intact and ruptured immature eggs 6 hpi. (L) Confocal images of macrophage recruitment 5 dpi to co-implanted mature and immature eggs into the same HBV of two different larvae. Enumeration of recruited macrophages showed 19 and 2 macrophages recruited respectively to the mature and immature egg (left panel), and 23 and 6 macrophages recruited respectively to the mature and immature egg (right panel). Scale bar, 50 μm. (G–I) Horizontal bars, mean values. Statistics, (B–E) Fisher’s exact test comparing the proportion of eggs that induced granuloma formation (black bars), or granuloma formation with macrophage recruitment (black and gray bars combined, in parentheses); (G–I and K) Student’s t test. (B–E) n, number of animals. All experiments performed once, except for (F, G, J, and K), which are representative of two experiments. Also see |
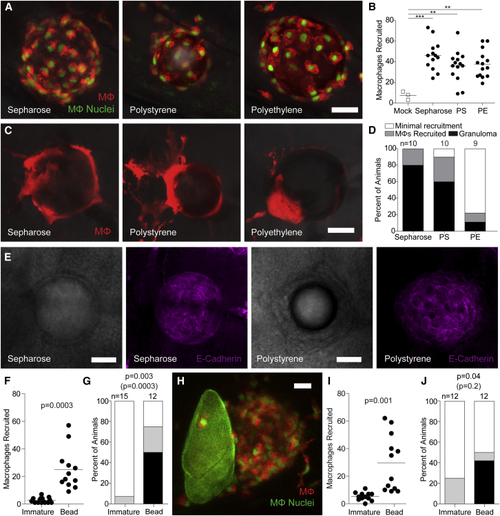
Chemically Inert Beads Induce Epithelioid Granulomas (A) Representative confocal images of macrophages recruited 6 hpi of sepharose, polystyrene, or polyethylene microspheres into the HBV of transgenic zebrafish larvae carrying red-fluorescent macrophages with green nuclei. (B) Enumeration of macrophages recruited to these microspheres in multiple animals. (C) Representative confocal images of granulomas formed around the three types of microspheres 5 dpi into the HBV of transgenic larvae carrying the transgene for red-fluorescent macrophages (without green nuclei). (D) Stages of macrophage recruitment to microspheres 5 dpi into HBV of multiple larvae. (E) Brightfield (panels 1 and 3) and fluorescence confocal (panels 2 and 4) microscopy of sepharose and polystyrene bead granulomas following immunofluorescence staining with the E-cadherin antibody. (F and G) Macrophage recruitment to immature eggs or microspheres implanted into the HBV at 6 hpi (F) and 5 dpi (G). (H–J) Macrophage recruitment following co-implantation of an immature egg and a polystyrene microsphere into the HBV of larvae transgenic for red-fluorescent macrophages with green nuclei. (H) Representative confocal image of an immature egg next to a microsphere. (I and J) Quantification of macrophage recruitment at 6 hpi (I) and at 5 dpi (J). Scale bars, 25 μm. (B, F, and I) Horizontal bars, means. (D, G, and J) n, number of animals. Statistics, one-way ANOVA (B), unpaired (F), and paired (I) Student’s t tests and Fisher’s exact test comparing granulomas (black bars) or granuloma formation with macrophage recruitment (black and gray bars, in parentheses) (G–J) Experiments in (E) and (F–J) were performed once. (A–D) are representative of three experiments. Also see |
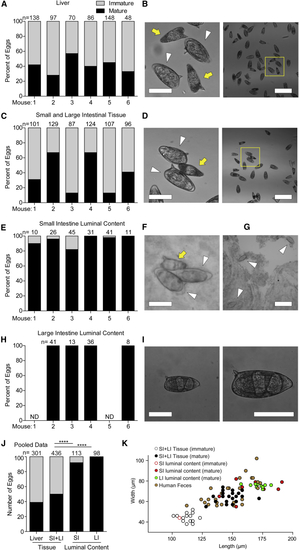
Mature Eggs Translocate into the Lumen of the Intestines (A–I) Quantification (A, C, E, and H) and representative brightfield images (B, D, F, G, and I) of mature and immature eggs found in the liver (A and B), small and large intestinal wall tissue and vasculature (C and D), small intestinal luminal content (E–G), and large intestinal luminal content (H and I) for six individual (B and D) Representative images with image (left) showing immature (yellow arrow) and mature (white arrowhead) magnified from yellow square in wide-field image (right). (F and G) Images of eggs from the lumen of the small intestine, showing two mature eggs in contact with one immature egg (F), and a wide-field image showing three mature eggs (G). (I) Representative image of an egg recovered from feces at low resolution (left) and higher resolution with developed miracidia visible (right). (J) Pooled data for mice 2, 3, 4, and 6 from (A, C, E, and H). SI, small intestine; LI, large intestine. (K) Dimensions of eggs from this experiment that were classified as immature or mature (open or closed circles, respectively) plotted with eggs shed in the feces of |