
- Title
-
Evolution of Listeria monocytogenes During a Persistent Human Prosthetic Hip Joint Infection
- Authors
- Muchaamba, F., Eshwar, A.K., von Ah, U., Stevens, M.J.A., Tasara, T.
- Source
- Full text @ Front Microbiol
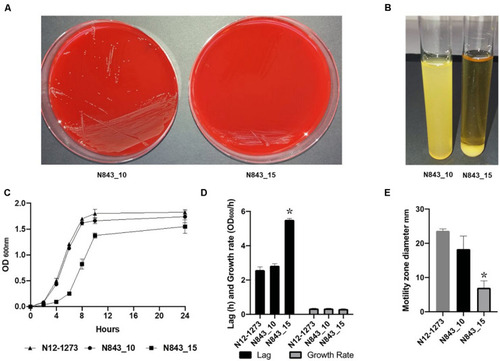
N843_15 exhibits slower growth, atypical aggregation behavior and reduced motility compared to N843_10. |
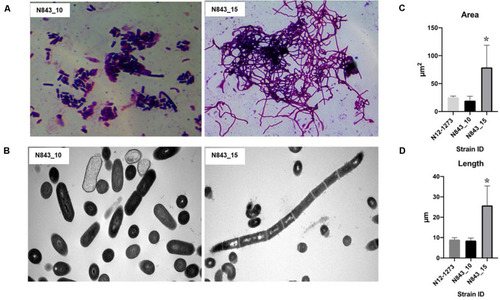
N843_10 and N843_15 cells display morphological differences. |
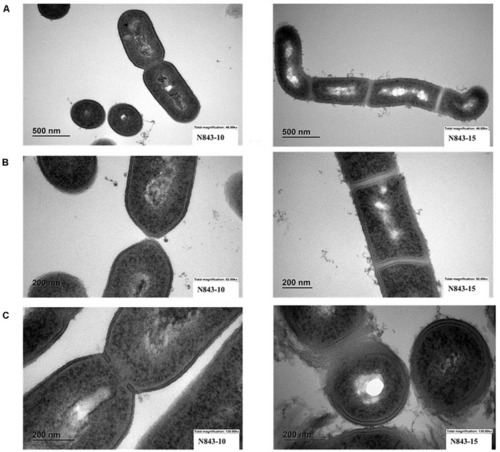
Electron microscopy (EM) reveals variations between N843_10 and N843_15 cell morphology. |

Overall growth or metabolic activity ring comparison of N843_15 and N843_10 with respect to C-source utilization (PM01 and PM02) and stress (osmolytes and pH; PM09 and PM10) resistance based on phenotypic microarray analysis. The gray inner circles indicate the strains’ order whilst the external circle indicates the PM categories. The metabolic activity referred to as activity index (AV) calculated for N843_15 under each assay condition per well is reported as color stripes going from red (AV = 0, no metabolism) to green (AV = 4, highest metabolic activity). Delta activity: the difference in the metabolic activity (AV) of N843_10 and N843_15 is reported when equal to or higher than 2 AV; gray is no difference; purple indicates a higher metabolic activity of N843_10 whilst orange color indicates that N843_10 has a lower metabolic activity than N843_15 under the assay conditions in that well. |
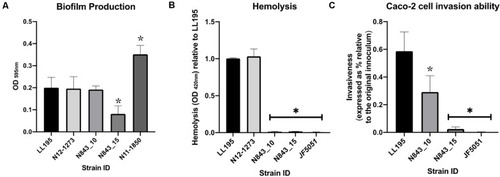
Biofilm production, hemolysis and Caco-2 cell invasion. |
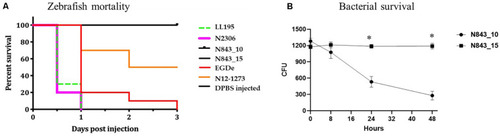
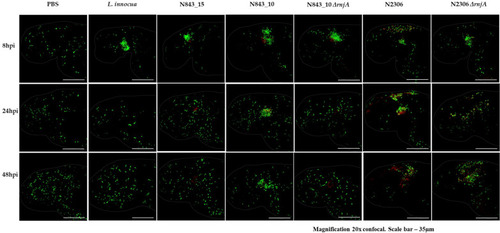
Strains vary in virulence and persistence within zebrafish: PHENOTYPE:
|
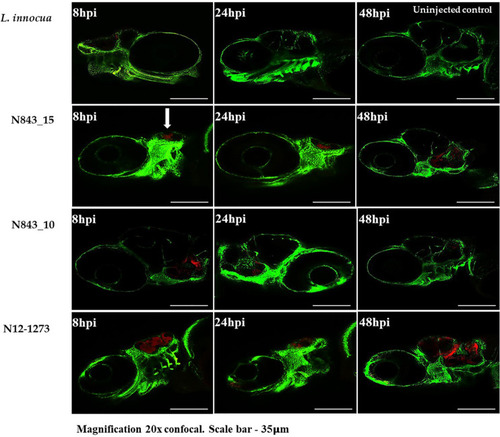
Localized infection simulation using |
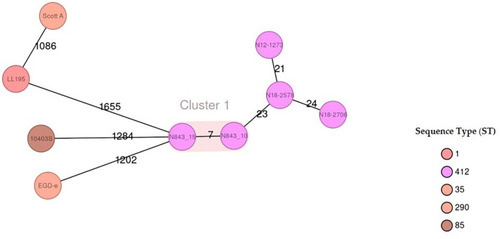
Minimum-spanning tree illustrating the phylogenetic relationship based on cgMLST allelic profiles of the 2 PJI isolates (N843_10 and N843_15) and seven selected reference strains including three CC412 isolates (N12-1273, N18-2578 and N18-2708). Each circle represents an allelic profile based on sequence analysis of 1,701 cgMLST target genes. The numbers on the connecting lines illustrate the numbers of target genes with differing alleles. The different groups of strains are distinguished by the colors of the circles. Clonal strains (cutoff 10 allele difference) are shaded in light brown. |
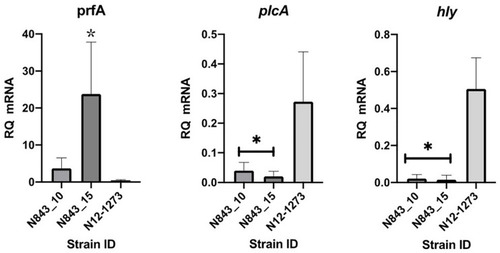
Impact of the PrfA truncation mutation predicted in N843_10 and N843_15 on virulence gene mRNA levels. Quantification of |
In the zebrafish |