
|
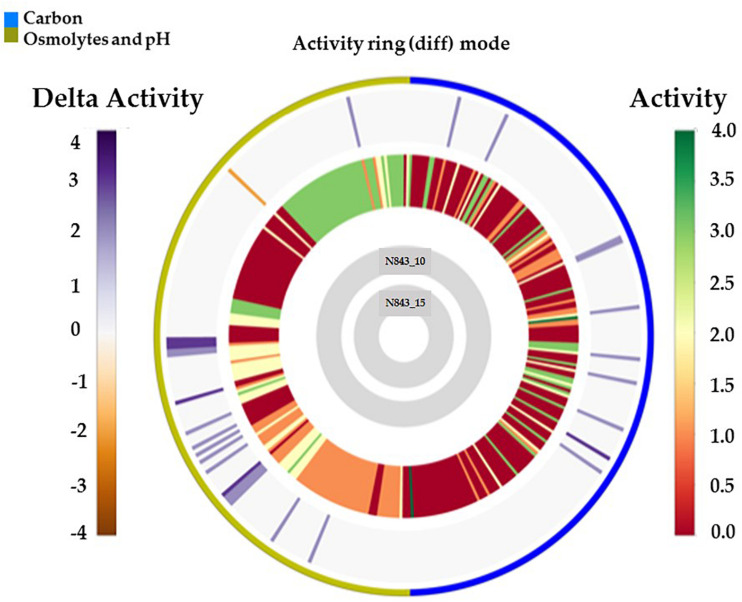
FIGURE 4
Overall growth or metabolic activity ring comparison of N843_15 and N843_10 with respect to C-source utilization (PM01 and PM02) and stress (osmolytes and pH; PM09 and PM10) resistance based on phenotypic microarray analysis. The gray inner circles indicate the strains’ order whilst the external circle indicates the PM categories. The metabolic activity referred to as activity index (AV) calculated for N843_15 under each assay condition per well is reported as color stripes going from red (AV = 0, no metabolism) to green (AV = 4, highest metabolic activity). Delta activity: the difference in the metabolic activity (AV) of N843_10 and N843_15 is reported when equal to or higher than 2 AV; gray is no difference; purple indicates a higher metabolic activity of N843_10 whilst orange color indicates that N843_10 has a lower metabolic activity than N843_15 under the assay conditions in that well.