FIGURE SUMMARY
Title

Three-dimensional bright-field microscopy with isotropic resolution based on multi-view acquisition and image fusion reconstruction

Authors
Calisesi, G., Candeo, A., Farina, A., D'Andrea, C., Magni, V., Valentini, G., Pistocchi, A., Costa, A., Bassi, A.
Source
Full text @ Sci. Rep.

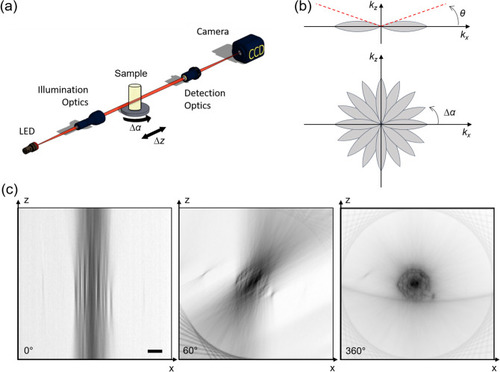
Experimental setup for multi-view bright-field reconstruction: an LED (530 nm) illuminates the sample, the transmitted light is collected by a detection optical system and a camera. The sample is mounted on a translation and a rotation stage to be scanned and rotated around 360°. A stack of images is acquired in each angular position while scanning the sample (a). Scheme of the Optical Transfer Function of the microscope (b, upper panel). Acquiring multiple views is equivalent to rotating the OTF and sampling different spatial frequencies (b, lower panel). Reconstruction of the transverse section of a sample (Arabidopsis thaliana) using a single view (0°), 10 views (covering 60° in total) and 60 views (covering 360°), each with a spacing of 6°. The illumination and detection numerical aperture is NA = 0.13 (c). Scale bar: 50 µm.

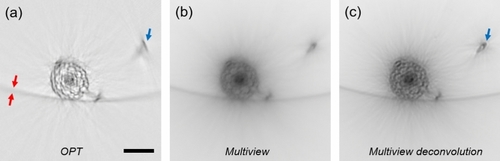
Reconstruction of a transverse section of an Arabidopsis thaliana root using Optical Projection Tomography (a), bright-field multi-view reconstruction (b) and bright-field multi-view deconvolution (c). For (c, d), 45 views around 360°, with 8° spacing were used. The presence of spatially variant artifacts in OPT is shown with the blue arrow. The red arrows indicate the thickness of the reconstructed plastic tube far from the rotation center of the OPT reconstruction. Scale bar: 100 µm.

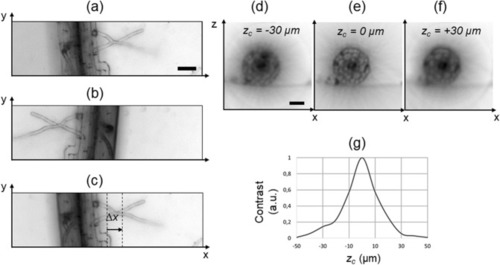
Search of the rotation axis. Minimum intensity projection (each pixel shows the minimum value of the stack calculated along the z direction) of the stack acquired at the angle 0° (a). Minimum intensity projection of the stack acquired at the angle 180° (b). The image shown in b, is flipped horizontally and translated to overlap the image in a. The distance Δx/2 indicates the position of the rotation axis from the image center, along the horizontal direction (c). Blurring artifacts arising from incorrectly identified axial position of the rotational axis zC (df). The contrast of a series of test reconstructions (g) has a maximum at the position corresponding to the correct rotational axis (zC = 0). Scale bars: 50 µm.

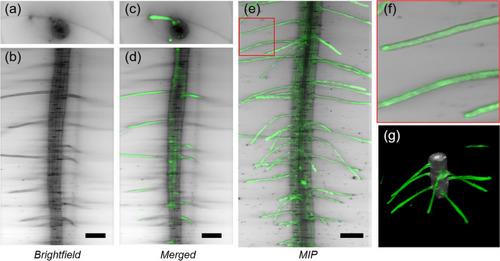
Three-dimensional imaging of a transgenic pEXP7:YC3.6 Arabidopsis thaliana seedling. Transverse (a) and lateral (b) sections of root tip (mature zone) acquired with bright-field multi-view reconstruction. Transverse (c) and lateral (d) sections acquired with bright-field reconstruction (grey) and LSFM (green). Maximum intensity projection of the LSFM stack, combined with the minimum intensity projection of the bright-field reconstruction (e). Detail of panel e, showing the outgrowing part of the root-hair epidermal cells (f). Three-dimensional rendering of the reconstructed bright-field volume, combined with LSFM. Scale bar: 100 µm.

Sagittal slice of a transgenic Tg(kdrl:GFP) zebrafish (4 dpf) visualized with bright-field multi-view reconstruction (a). Details of the sample showing a portion of the head (b) and of the zebrafish notochord (c). Minimum intensity projection of the bright-field reconstruction (grey) overlapped with the maximum intensity projection of the LSFM data (green). The bright-field reconstruction shows the whole zebrafish anatomy while LSFM shows the labelled vasculature (d). Transverse section of the sample in the head (e) and tail (f), showing the bright-field reconstruction (grey) and LSFM (green). Scale bars: 100 µm.

Acknowledgments
This image is the copyrighted work of the attributed author or publisher, and ZFIN has permission only to display this image to its users. Additional permissions should be obtained from the applicable author or publisher of the image. Full text @ Sci. Rep.