IMAGE

Figure 3

ID
ZDB-IMAGE-200803-4
Source
Figures for Calisesi et al., 2020
Image
Figure Caption

Figure 3

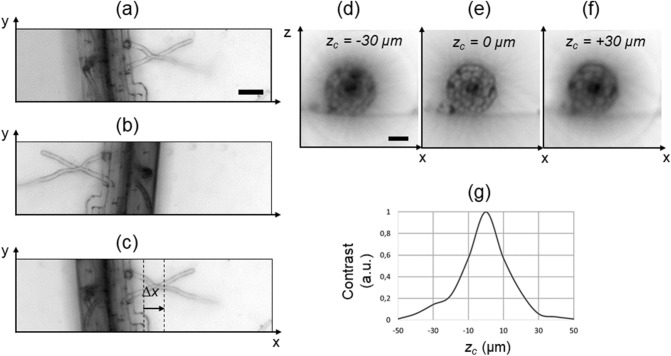
Search of the rotation axis. Minimum intensity projection (each pixel shows the minimum value of the stack calculated along the z direction) of the stack acquired at the angle 0° (a). Minimum intensity projection of the stack acquired at the angle 180° (b). The image shown in b, is flipped horizontally and translated to overlap the image in a. The distance Δx/2 indicates the position of the rotation axis from the image center, along the horizontal direction (c). Blurring artifacts arising from incorrectly identified axial position of the rotational axis zC (df). The contrast of a series of test reconstructions (g) has a maximum at the position corresponding to the correct rotational axis (zC = 0). Scale bars: 50 µm.

Acknowledgments
This image is the copyrighted work of the attributed author or publisher, and ZFIN has permission only to display this image to its users. Additional permissions should be obtained from the applicable author or publisher of the image. Full text @ Sci. Rep.