FIGURE SUMMARY
Title

Multiple cryoinjuries modulate the efficiency of zebrafish heart regeneration

Authors
Bise, T., Sallin, P., Pfefferli, C., Jaźwińska, A.
Source
Full text @ Sci. Rep.

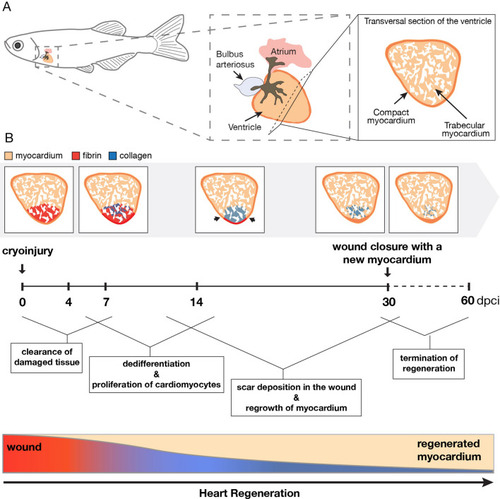
Schematic summary of the regenerative processes after cryoinjury in the zebrafish heart. (A) Illustration of the anatomy and histology of an intact zebrafish heart. The ventricle comprises a trabecular myocardium (beige) that is surrounded by a thin layer of a compact myocardium (orange). (B) Illustration of the main cellular processes after cryoinjury during the regeneration time. The prominent events are written in the boxes and linked to the specific periods after cryoinjury. The schematic heart sections were based on AFOG histological staining that visualizes the myocardium in beige/orange, collagen in blue and fibrin-like material in red. The injury zone switches from red staining at 4 and 7 dpci, to blue collagen staining after 7 dpci. At the bottom, the rectangular graph depicts a progressive replacement of the wound with a new myocardium. During this time, the wounded tissue undergoes remodeling, starting from the inflammatory state (red gradient) followed by collagenous scar deposition (inverse blue gradient).

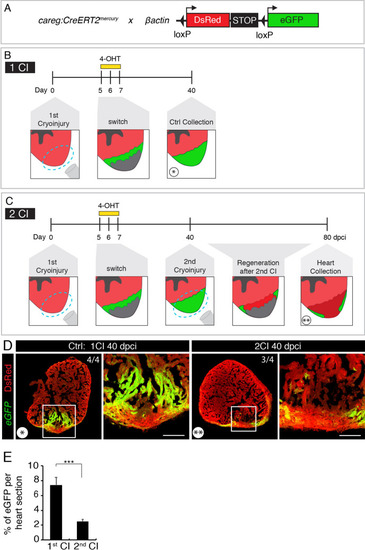
Repeated cryoinjuries target the same part of the zebrafish heart. (A) Schematic representation of the transgenic fish lines used for the cell-lineage tracing experiment. (B, C) Experimental designs. (B) The strategy to label the regenerated myocardium after cryoinjury (CI). The entire myocardium expresses ßactin:DsRed. careg:Cre-ERT2 is activated in the peri-injury zone in regenerating cardiomyocytes. Treatment with 4-hydroxytamoxifen (4-OHT) for 2 days starting at 5 dpci (days post-cryoinjury) results in Cre-loxP recombination that leads to eGFP expression in the new myocardium, as assessed at 40 dpci. (C) The strategy to assess if the regenerated myocardium is damaged by the subsequent cryoinjury. At 40 dpci, another cryoinjury is performed, and hearts are analyzed after subsequent 40 days. (D) Cross-sections of zebrafish hearts at 40 dpci after one (*) or two (**) cryoinjuries (CIs). The first regenerated myocardium is labelled by eGFP. The second cryoinjury destroyed this regenerated tissue, as revealed by the loss of the majority of the eGFP-positive myocardium. The number in the upper right corner of each image represents the fraction of analyzed fish with the displayed phenotype. Scale bar = 100 µm. (E) Histogram showing the proportion of eGFP-labelled myocardium relative to the ventricular area after one or two cryoinjuries. The 2nd cryoinjury leads to a significant decrease of 4-OHT-induced eGFP expressing cells compared to hearts after one cryoinjury. N = 4. In this and all subsequent figures, frames depict the areas that are shown at higher magnification to the right of each image.

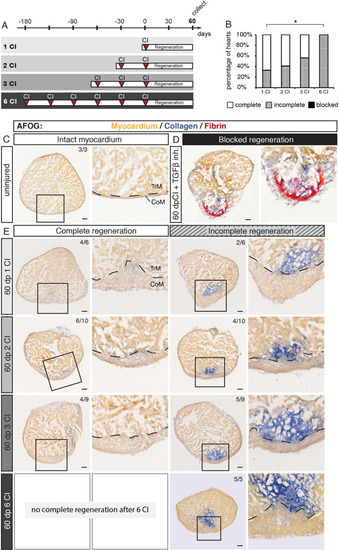
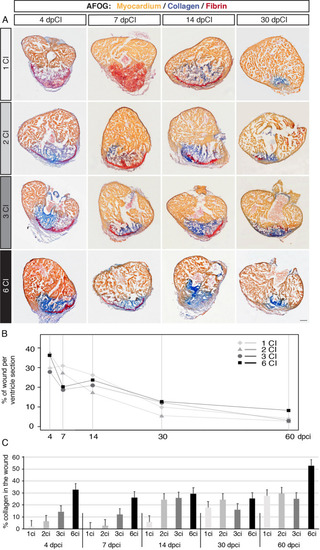
The capacity of complete regeneration is limited after six cryoinjuries. (A) Experimental design showing a schedule of cryoinjuries that were performed every month in the same animals. After the last cryoinjury, hearts were allowed to regenerate for 60 days. (B) Histograms representing the percentage of zebrafish hearts with complete (white), incomplete (gray) or blocked (black) regeneration after one, two, three or six cryoinjuries (CIs). N ≥ 5. *P < 0.05, Student t-test. (CE) Histological staining of cross-sections with AFOG reagent showing the myocardium (beige), fibrin (red) and collagen (blue). (C) Uninjured hearts do not contain collagen (blue) in the myocardium. (D) An example of blocked regeneration at 60 dpci, following inhibition of the TGF-ß signaling pathway with the chemical antagonist SB431542. Blocked regeneration is featured by the presence of fibrin around the wound, and a lack of myocardium in the wounded area. (E) Representative sections of hearts exhibiting complete and incomplete regeneration at 60 dpci after one, two, three or six cryoinjuries. Dashed line in images at higher magnification marks the junctional region between the trabecular (TrM) and compact (CoM) myocardium. The number in the upper right corner of each image represents the fraction of analyzed fish with the displayed phenotype. Scale bar = 50 µm.

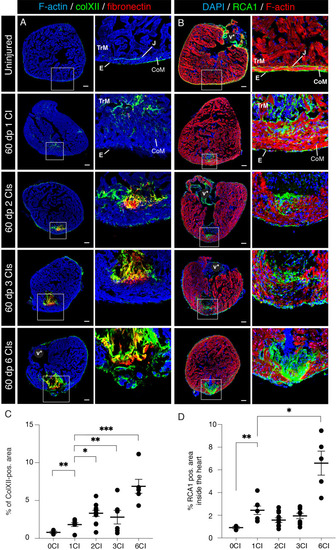
Multiple cryoinjuries enhance deposition of ColXII and connective tissue in the remaining fibrotic tissue. (A) Cross sections of adult zebrafish hearts immunostained for the type XII collagen (ColXII; green) and Fibronectin (red) in uninjured hearts and at 60 dpci, following one, two, three or six cryoinjuries. The cardiac muscle is detected by F-actin staining (Phalloidin, blue). In uninjured hearts, ColXII is detected in the epicardium (E) and the junctional region (J) between the compact myocardium (CoM) and the trabecular myocardium (TrM). After cryoinjuries, the fibrotic tissue of partially regenerated hearts contains ColXII and Fibronectin (yellow through an overlay of green and red staining). (B) Cross sections of adult zebrafish hearts stained with fluorescein-conjugated lectin Ricinus communis agglutinin 1 (RCA1, green). The cardiac muscle is detected by F-actin staining (Phalloidin, red). In uninjured hearts, RCA1 labels the valve (V), the epicardium (E) and the junctional region (J) between the compact (CoM) and the trabecular myocardium (TrM). After cryoinjuries, the fibrotic tissue of partially regenerated hearts displays abundant RCA1 labelling. (C) Analysis of the percentage of ColXII-positive area per heart section. N ≥ 5. *P < 0.05; **P < 0.01; ***P < 0.001. Scatter plot of the data with a large bar indicating the mean and smaller bars representing the SEM. (D) Analysis of the percentage RCA1-positive area per heart section. N ≥ 5. *P < 0.05; **P < 0.01. Scatter plot of the data with a large bar indicating the mean and smaller bars representing the SEM.

Increased recruitment of Mpx-positive neutrophils at the onset of regeneration after multiple cryoinjuries. (A) Cross sections of adult zebrafish hearts immunostained for L-plastin (green) and Myeloperoxydase (Mpx, red) at 4 dpci following one, two three and six cryoinjuries (CIs). The cardiac muscle is detected by F-actin staining (Phalloidin, blue). Both L-plastin and Mpx were detected in the wound. L-plastin/Mpx double positive cells are indicated (white arrow). The dashed line encircles the post-injury zone. Scale bars = 100 µm. (B) Analysis of the percentage of L-plastin-positive area within the wound. No significant change (NS) is observed between the experimental groups. N ≥ 3. Scatter plot of the data with a large bar indicating the mean and smaller bars representing the SEM. (C) Analysis of the percentage of Mpx-positive area in the wound. Multiple cryoinjuries significantly increase the number of neutrophils compared to specimens after one cryoinjury. N ≥ 3; *P < 0.05. Scatter plot of the data with a large bar indicating the mean and smaller bars representing the SEM.

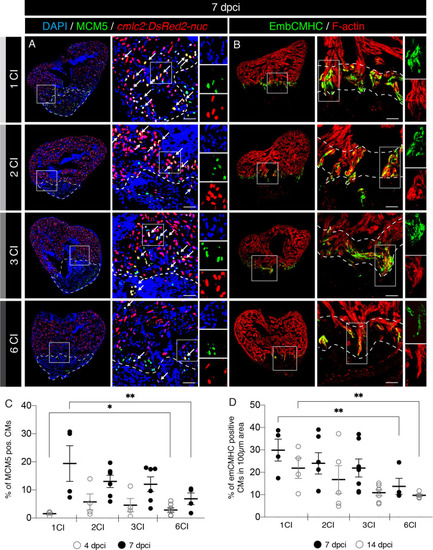
A decreased activation of cardiomyocyte proliferation and dedifferentiation after multiple cryoinjuries. (A) Cross sections of transgenic zebrafish hearts at 7 dpci following 1, 2, 3 or 6 CIs expressing nuclear DsRed in cardiomyocytes. Proliferating cells are detected by immunostaining against Minichromosome Maintenance Complex Component 5 (MCM5; green). Proliferating cardiomyocytes are observed (white arrows) by colocalization between cmlc2:DsRed2-nuc and MCM5 in the vicinity of the wound (encircled with a dash line). Scale bars = 50 µm. (B) Cross sections of adult zebrafish hearts at 7 dpci following 1, 2, 3 or 6 CIs, immunostained for embryonic cardiac myosin heavy chain (EmbCMHC; N2.261; green). The cardiac muscle is detected by F-actin staining (Phalloidin, red). EmbCMHC-positive cardiomyocytes are detected in the peri-injury zone within an area of 100 µm from the injury border (dashed line). (C) Analysis of the percentage of MCM5-positive nuclei of cardiomyocytes (CMs) at 4 and 7 dpci, following multiple cryoinjuries. N ≥ 4. *P < 0.05; **P < 0.01. Scatter plot of the data with a large bar indicating the mean and smaller bars representing the SEM. (D) Analysis of the percentage of embCMHC-positive cardiomyocytes (CMs) at 7 and 14 dpci, within the peri-injury zone. N ≥ 4. **P < 0.01. Scatter plot of the data with a large bar indicating the mean and smaller bars representing the SEM.

Comparison of regenerative dynamics between hearts after multiple cryoinjuries. (A) Representative sections of regenerating hearts stained with the AFOG reagent, showing the myocardium (beige), fibrin (red) and collagen (blue) at different time points following cryoinjuries. At 4 and 7 dpci, the wound contains markedly more collagen after multiple cryoinjuries as compared to that after one cryoinjury. Scale bar = 100 µm. (B) Linear representation of the percentage of wounded area per ventricle sections at different regenerative time-points. All experimental groups exhibit similar dynamics of regeneration, but hearts after six cryoinjuries comprise the largest wound as compared to other groups, at 60 dpci. N ≥ 4 hearts, 3 sections per heart. (C) Histogram showing the percentage of collagen staining within the remaining wounded area. After multiple cryoinjuries, the amount of collagen is high already at the early time points of regeneration. N ≥ 4 hearts, 3 sections per heart.

Acknowledgments
This image is the copyrighted work of the attributed author or publisher, and ZFIN has permission only to display this image to its users. Additional permissions should be obtained from the applicable author or publisher of the image. Full text @ Sci. Rep.