FIGURE SUMMARY
Title

Zebrafish (Danio rerio) physiological and behavioural responses to insect-based diets: a multidisciplinary approach

Authors
Zarantoniello, M., Randazzo, B., Gioacchini, G., Truzzi, C., Giorgini, E., Riolo, P., Gioia, G., Bertolucci, C., Osimani, A., Cardinaletti, G., Lucon-Xiccato, T., Milanović, V., Annibaldi, A., Tulli, F., Notarstefano, V., Ruschioni, S., Clementi, F., Olivotto, I.
Source
Full text @ Sci. Rep.

Zebrafish fed experimental diets specific growth rate (% weight growth day−1). Zebrafish fed diets including 0, 25, 50, 75 and 100% of BSF meal (Control, Hi25, Hi50, Hi75 and Hi100, respectively). Boxplots show minimum and maximum (whiskers), first quartile, median and third quartile (box). Different letters indicate statistically significant differences among experimental groups (p < 0.05).

Content of SFA, MUFA and PUFA fatty acid (as % of total FA) and omega 3 (n3), omega 6 (n6) and omega 9 (n9) fatty acid contribution to lipid profile. (A,B) experimental diets including increasing BSF meal percentages (0, 25, 50, 75, and 100%, respect to fish meal) and (C,D) zebrafish fed on the different diets. Different letters show statistically significant differences among experimental groups compared within the same fatty acid class (p < 0.05). Values are showed as mean ± SD (n = 3 for experimental diets; n = 15 for zebrafish).

Zebrafish (Control, Hi25,50,75,100 groups) intestine and liver histology and percentage of fat fraction (PFF) in liver tissue. a–j: intestine; k–o: liver; p: PFF%. Histology scale bars: a–e:50 µm; f–j: 20 µm; k–o: 10 µm. For PFF%, values are showed as mean ± SD (n = 15). Different letters indicate statistically differences among the experimental groups (p < 0.05).

(A) Average absorbance spectra and (B) biochemical composition of Zebrafish brain samples of all dietary groups. (A) Spectra are reported in the 3050–900 cm-1 spectral range and are shifted along the y-axis for a better understanding. The wavenumbers of the most significant bands are reported in the upper part. (B) Univariate analysis of the following band area ratios: LIP/TBM (relative amount of total lipids); FA/TBM (relative amount of fatty acids); CH/TBM (degree of unsaturation in lipid alkyl chains); PRT/TBM (relative amount of total proteins); PH/TBM (relative amount of phosphate groups), and COH/TBM (relative amount of carbohydrates). Data are reported as mean ± SD. Statistically significant differences are indicated by different letters (p < 0.05). Zebrafish fed diets including 0, 25, 50, 75 and 100% of BSF meal (Control, Hi25, Hi50, Hi75 and Hi100, respectively).

(A) Microphotographs, hyperspectral analysis, and (B) biochemical composition of representative liver sections belonging to all dietary groups. (A) False color images showing the topographical distribution of lipids (LIP), fatty acids (FA), proteins (PRT), phosphate groups (PH), carbohydrates (COH), and glycogen (GLY). (B) Univariate analysis of the following band area ratios: LIP/TBM (relative amount of total lipids); FA/TBM (relative amount of fatty acids); PRT/TBM (relative amount of total proteins); PH/TBM (relative amount of phosphate groups); COH/TBM (relative amount of total carbohydrates), and GLY/TBM (relative amount of glycogen). Data are reported as mean ± SD. Statistically significant differences are indicated by different letters (p < 0.05). Zebrafish fed diets including 0, 25, 50, 75 and 100% of BSF meal (Control, Hi25, Hi50, Hi75 and Hi100, respectively).

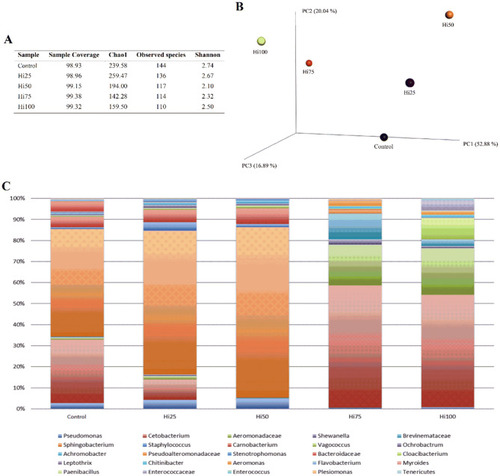
Microbiome of zebrafish fed diets including 0, 25, 50, 75 and 100% of BSF meal (Control, Hi25, Hi50, Hi75 and Hi100, respectively). (A) Number of sequences analysed, observed diversity and sample coverage for 16 s rrna amplicons acquired from zebrafish gut samples. (B) Principal coordinates analysis of weighted UniFrac distances for 16S rRNA gene sequence data assembled as a function of the dietary BSF amount. The first component (PC1) accounts for the 52.88% of the variance, the second one (PC2) for the 20.04% and the third one (PC3) for the 16.89%. (C) Frequency of the major taxonomic groups identified by sequencing. Only OTUs with an incidence > 0.2% are shown.

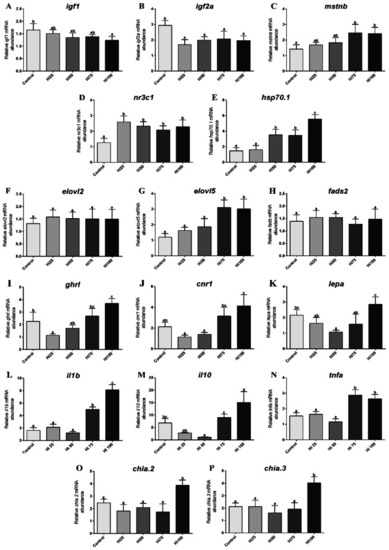
Relative mRNA abundance of genes analyzed in zebrafish fed on the different experimental diets (Control, Hi25, Hi50, Hi75 and Hi100). (A) igf1, (B) igf2a, (C) mstnb, (D) nr3c1, (E) hsp70.1, (F) elovl2, (G) elovl5 and (H) fads2 were analysed in liver samples; (I) ghrl, (J) cnr1, (K) lepa, (L) il1b, (M) il10, (N) tnfa, (O) chia.2 and (P) chia.3 were analysed in intestine samples. Different letters specify statistically significant differences among groups (p < 0.05). Values are showed as mean ± SD (n = 5).

Behaviour. (A) activity and (B) time spent in the centre of the arena of zebrafish and tested in the open-field test. Dots represent means and error bars represent SE. Data are plotted in 1-min blocks. (C) Photic entrainment test: locomotor activity of zebrafish exposed to a 12 h:12 h light:dark cycle in the photic entrainment test. Black bars at the top of the graph indicate dark phases the LD cycles (light-on: 08:00, lights-off: 20:00). Dots represent means of 6-min time blocks. Zebrafish fed diets including 0, 25, 50, 75 and 100% of BSF meal (Control, Hi25, Hi50, Hi75 and Hi100).

Acknowledgments
This image is the copyrighted work of the attributed author or publisher, and ZFIN has permission only to display this image to its users. Additional permissions should be obtained from the applicable author or publisher of the image. Full text @ Sci. Rep.