
- Title
-
Connexin43 gap junctional intercellular communication inhibits evx1 expression and joint formation in regenerating fins
- Authors
- Bhattacharya, S., Hyland, C., Falk, M.M., Iovine, M.K.
- Source
- Full text @ Development
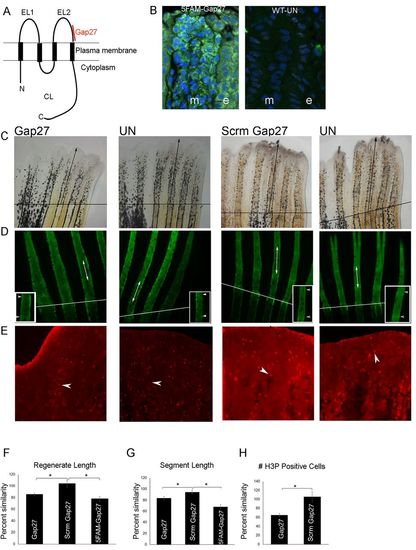
Inhibition of Cx43-GJIC recapitulates sofb123 phenotypes. (A) Schematic of Cx43 showing the location of Gap27 interaction with the second extracellular loop. N, amino terminus; C, carboxy terminus; EL1/EL2, extracellular loop1/2; CL, cytoplasmic loop. (B) Representative longitudinal cross-sections showing localization of 5FAM-Gap27 (green) following its injection. DAPI (blue) stains cell nuclei. m, mesenchyme; e, epidermis. UN, uninjected. (C) Regenerate length is reduced in Gap27-injected fins compared with Scrm-Gap27-injected fins. All fins were amputated at the 50% level. The amputation plane is indicated (black line). Black arrow indicates the distance from the amputation plane to the distal tip of the third fin ray. Injections were performed at 3 dpa and measurements were taken at 7 dpa. UN, uninjected. Bar graph (F) shows a significant reduction in the percentage similarity between Gap27 and Scrm-Gap27 (one-way ANOVA with Tukey's and Dunnett's multiple comparison as post-hoc tests; *P<0.05). n=21; three independent replicates. (D) Calcein-stained fin rays show reduced segment length in Gap27-injected fins compared with Scrm-Gap27-injected fins. Arrows and arrowheads point to the first two joints following the amputation plane (white line). The inset shows a higher magnification of the segments. Bar graph (G) reveals a significant reduction in the percentage similarity between Gap27 and Scrm-Gap27 (one-way ANOVA with Tukey's and Dunnett's multiple comparison as post-hoc tests; *P<0.05). n=19; three independent replicates. (E) H3P+ cells are reduced in number in Gap27-injected fins compared with Scrm-Gap27-injected fins. Arrowheads identify one H3P+ cell per image. Bar graph (H) reveals a significant reduction in the percentage similarity between Gap27 and Scrm-Gap27. Student's t-test, two tailed and unpaired, *P<0.05 (n=23, three independent replicates). Data are mean±s.e.m. |

Cx43-GJIC influences changes in gene expression. (A) Proposed pathway for changes in gene expression influenced by Cx43-GJIC. (B) Gap27 injections lead to reduced smpexpression compared with Scrm-Gap27 injections (n=15). Asterisks indicate identification of stained fin rays. (C) Gap27 injections lead to increased frequency of evx1 expression compared with Scrm-Gap27 injections (n=10, three independent replicates). + indicates fin rays positive for evx1; − indicates fin rays negative for evx1. (D) Bar graph showing increased percentage of evx1+ fin rays with Gap27 injections compared with Scrm-Gap27 injections (Student's t-test, two tailed and unpaired, *P<0.05). n=16; three independent replicates. Data are mean±s.e.m. Scale bar: 50 µm. |

ZFIN is incorporating published figure images and captions as part of an ongoing project. Figures from some publications have not yet been curated, or are not available for display because of copyright restrictions. EXPRESSION / LABELING:
PHENOTYPE:
|

The cx43lh10 allele exhibits Cx43 overexpression phenotypes. (A) Schematic of Cx43 protein showing the location of the carboxy-tail deletion. N, amino terminus; C, carboxy terminus; EL1/EL2, extracellular loop1/2; CL, cytoplasmic loop. (B) Regenerating fins in cx43lh10mutants exhibit longer regenerate length compared with wild type (WT). All fins were amputated at the 50% level. The amputation plane is indicated (black line). Black arrows indicate the distance from the amputation plane to the distal tip of the third fin ray. Bar graph shows a significant reduction in regenerate length between cx43lh10 and wild type (Student's t-test, two tailed and unpaired, *P<0.05). n=22; three independent replicates. (C) Regenerating fins in cx43lh10 mutants exhibit longer fin ray segments compared with wild type. Arrows and arrowheads point to the first two joints following the amputation plane (white line). The inset shows a higher magnification of the segments. Bar graph reveals a significant reduction in segment length between cx43lh10 and wild type (Student's t-test, two-tailed and unpaired, *P<0.05). n=23; three independent replicates. (D) Regenerating fins in cx43lh10 mutants exhibit reduced evx1 expression compared with wild type. + indicates fin rays positive for evx1; − indicates fin rays negative for evx1. Bar graph shows the percentage of evx1+ fin rays is reduced in cx43lh10 compared with wild type. Student's t-test, two tailed and unpaired, *P<0.05. (n=10; three independent replicates). Data are mean±s.e.m. PHENOTYPE:
|
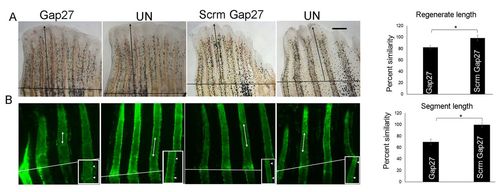
Inhibition of Cx43-GJIC rescues cx43lh10 phenotypes. (A) Gap27 injection rescues regenerate length in cx43lh10 fins. Fins were amputated at the 50% level. The amputation plane is indicated (black line). Black arrows indicate the distance from the amputation plane to the distal tip of the third fin ray. Bar graph shows reduced regenerate length in cx43lh10 fins injected with Gap27 compared with cx43lh10 fins injected with Scrm-Gap27 (Student's t-test, two tailed and unpaired, *P<0.05). n=14; three independent replicates. (B) Gap27 injection rescues segment length in cx43lh10 fins. Representative images are shown. Arrows and arrowheads point to the first two joints following the amputation plane (white line). The inset shows a higher magnification of the segments. Bar graph shows reduced segment length in cx43lh10 fins injected with Gap27 compared with cx43lh10 fins injected with Scrm-Gap27. Student's t-test, two-tailed and unpaired, *P<0.05 (n=14, three independent replicates). Data are mean±s.e.m. Scale bar: 50 µm. |