FIGURE SUMMARY
Title

Inhibition of the STAT3 Signaling Pathway Contributes to the Anti-Melanoma Activities of Shikonin

Authors
Cao, H.H., Liu, D.Y., Lai, Y.C., Chen, Y.Y., Yu, L.Z., Shao, M., Liu, J.S.
Source
Full text @ Front Pharmacol

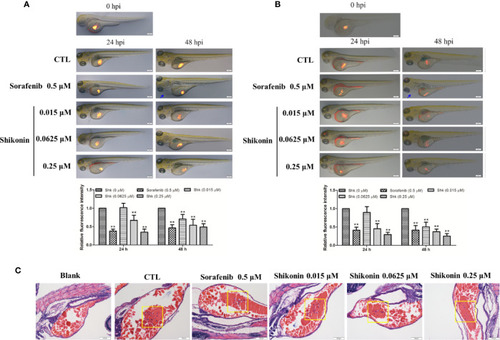
Shikonin inhibited melanoma tumor growth in zebrafish xenograft model. Fluorescently labeled (A) A375 or (B) A2058 cells were microinjected into the yolk sac of 2 dpf zebrafish embryos. These zebrafish were then transferred randomly to 24-well plates, 10 embryos per well with 0.5 ml of embryo medium containing indicated concentrations of shikonin or sorafenib for a treatment period of 48 h. Representative images of embryos were shown as merged bright-field and fluorescent images at 0, 24, and 48 h. Relative fluorescence intensity were analyzed by Image J software. Data were shown as mean ± SD from three independent experiments, **P < 0.01. Blue arrows indicated pericardia. (C) H&E staining of A375 cell transplanted zebrafish. Tumor cells in yolk were shown (yellow squares).

Shikonin reduced viability and induced apoptosis in human melanoma cells. A375 and A2058 cells were treated with indicated concentrations of shikonin. (A) Cell viability was measured by MTT assay after 24 or 48 h treatment. (B) Represented photos showed the effect of shikonin on clonogenic survival of A375 and A2058 cells. (C) Cell cycle phases of the treated cells were evaluated by flow cytometry and analyzed by ModFit software. The DNA content of cells at different cell phase was presented as the mean ± SD of three independent experiments. *P < 0.05 and **P < 0.01. (D) Apoptosis was analyzed by flow cytometry after 24 h treatment. The percentage of apoptotic cells was presented as the mean ± SD of three independent experiments. *P < 0.05 and **P < 0.01. (E) Cleavages of PARP and caspase-3 were detected by Western blot analysis after 24 h treatment (left panel) and relative expression levels (right panel) were analyzed by Image J software. Data were shown as mean ± SD from three independent experiments, *P < 0.05, **P < 0.01.

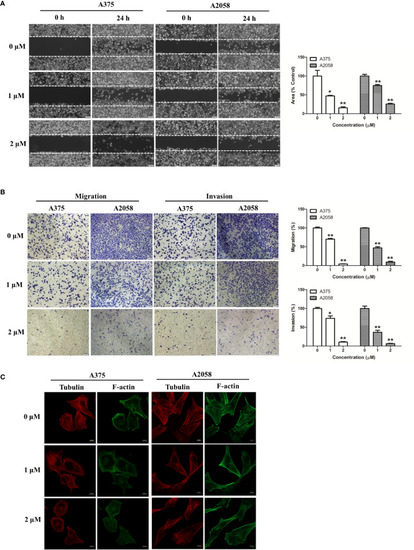
Shikonin inhibited melanoma cell migration and invasion. (A) A single scratch was created in the confluent monolayer of A375 or A2058 cells. The scratch was photographed at 0 and 24 h after shikonin treatment (left) and relative migrated areas (right) were analyzed by Image J software. (B) Cells were allowed to migrate through membranes without or with Matrigel basement in the presence of indicated concentration of shikonin. Representative photographs of migrated/invasive cells (left) and quantification of these cells (right) were shown. (C) Cells were treated with shikonin for 24 h and changes in Tubulin and F-actin were visualized using confocal microscope. Data were shown as mean ± SD from three independent experiments, *P < 0.05 and **P < 0.01.

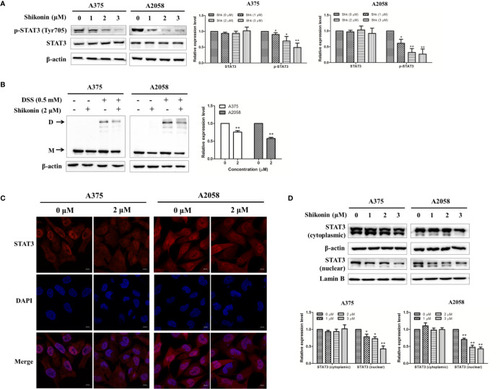
Shikonin inhibited STAT3 signaling pathway in melanoma cells. (A) Cells were treated with indicated concentration of shikonin for 24 h, expression levels of STAT3 and p-STAT3 were determined by the Western blot analysis (upper), and relative expression levels were analyzed by Image J software (bottom). (B) Cells were treated with 2 μM shikonin for 24 h, and then incubated with DSS. Changes in STAT3 dimerization were evaluated by immunoblotting. The arrows indicated the dimer (D) and the monomer (M) STAT3. The representative results (upper) and the relative expression levels of dimer STAT3 (bottom) were shown. (C, D) Cells were treated with indicated concentration of shikonin for 24 h, and then the intracellular distribution of STAT3 was analyzed by immunofluorescence assay (C) and immunoblotting (D). Relative expression levels of cytosolic and nuclear STAT3 were also shown (bottom). Data were shown as mean ± SD from three independent experiments, *P < 0.05 and **P < 0.01.

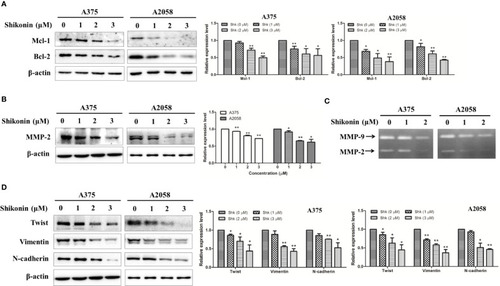
Shikonin down-regulated protein levels and inhibited enzymatic activities of STAT3-targeted molecules in melanoma cells. A375 and A2058 cells were treated with indicated concentrations of shikonin for 24 h, and then total cell lysates were collected, expression levels of (A) Mcl-1, Bcl-2, (B) MMP-2, (D) Twist, Vimentin, and N-cadherin were evaluated by Western blot analysis (left) and relative expression levels were analyzed by Image J software (right). Data were shown as mean ± SD from three independent experiments, *P < 0.05 and **P < 0.01. (C) The enzymatic activities of MMP-2 and MMP-9 were determined by gelatinase zymography.

Overexpression of STAT3 in human melanoma A375 cells reduced shikonin-mediated cell growth, migration, and invasion inhibition. A375 cells were transiently transfected with an empty vector or a STAT3C-expressing construct for 24 h, and then (A) the expression level of STAT3 in A375-STAT3C cells and A375-EV cells were examined by immunoblotting. (B–D) A375-EV or A375-STAT3C cells were incubated with shikonin for 48 h or 24 h, and then (B) cell proliferation, (C) cell migratory, and (D) cell invasive abilities were measured. Representative photographs of migrated cells (left) and quantification of these cells (right) were shown. Data were mean ± SD from three independent experiments, ##P < 0.01, *P < 0.05, and **P < 0.01.

Acknowledgments
This image is the copyrighted work of the attributed author or publisher, and ZFIN has permission only to display this image to its users. Additional permissions should be obtained from the applicable author or publisher of the image. Full text @ Front Pharmacol